Alpha Consensus — X’s Best Traders
📡 Stock Market Voices
Alpha Consensus tracks public market accounts on X and turns their scattered stock opinions, news, fund flows, and disclosed trades into a structured market consensus Dashboard.
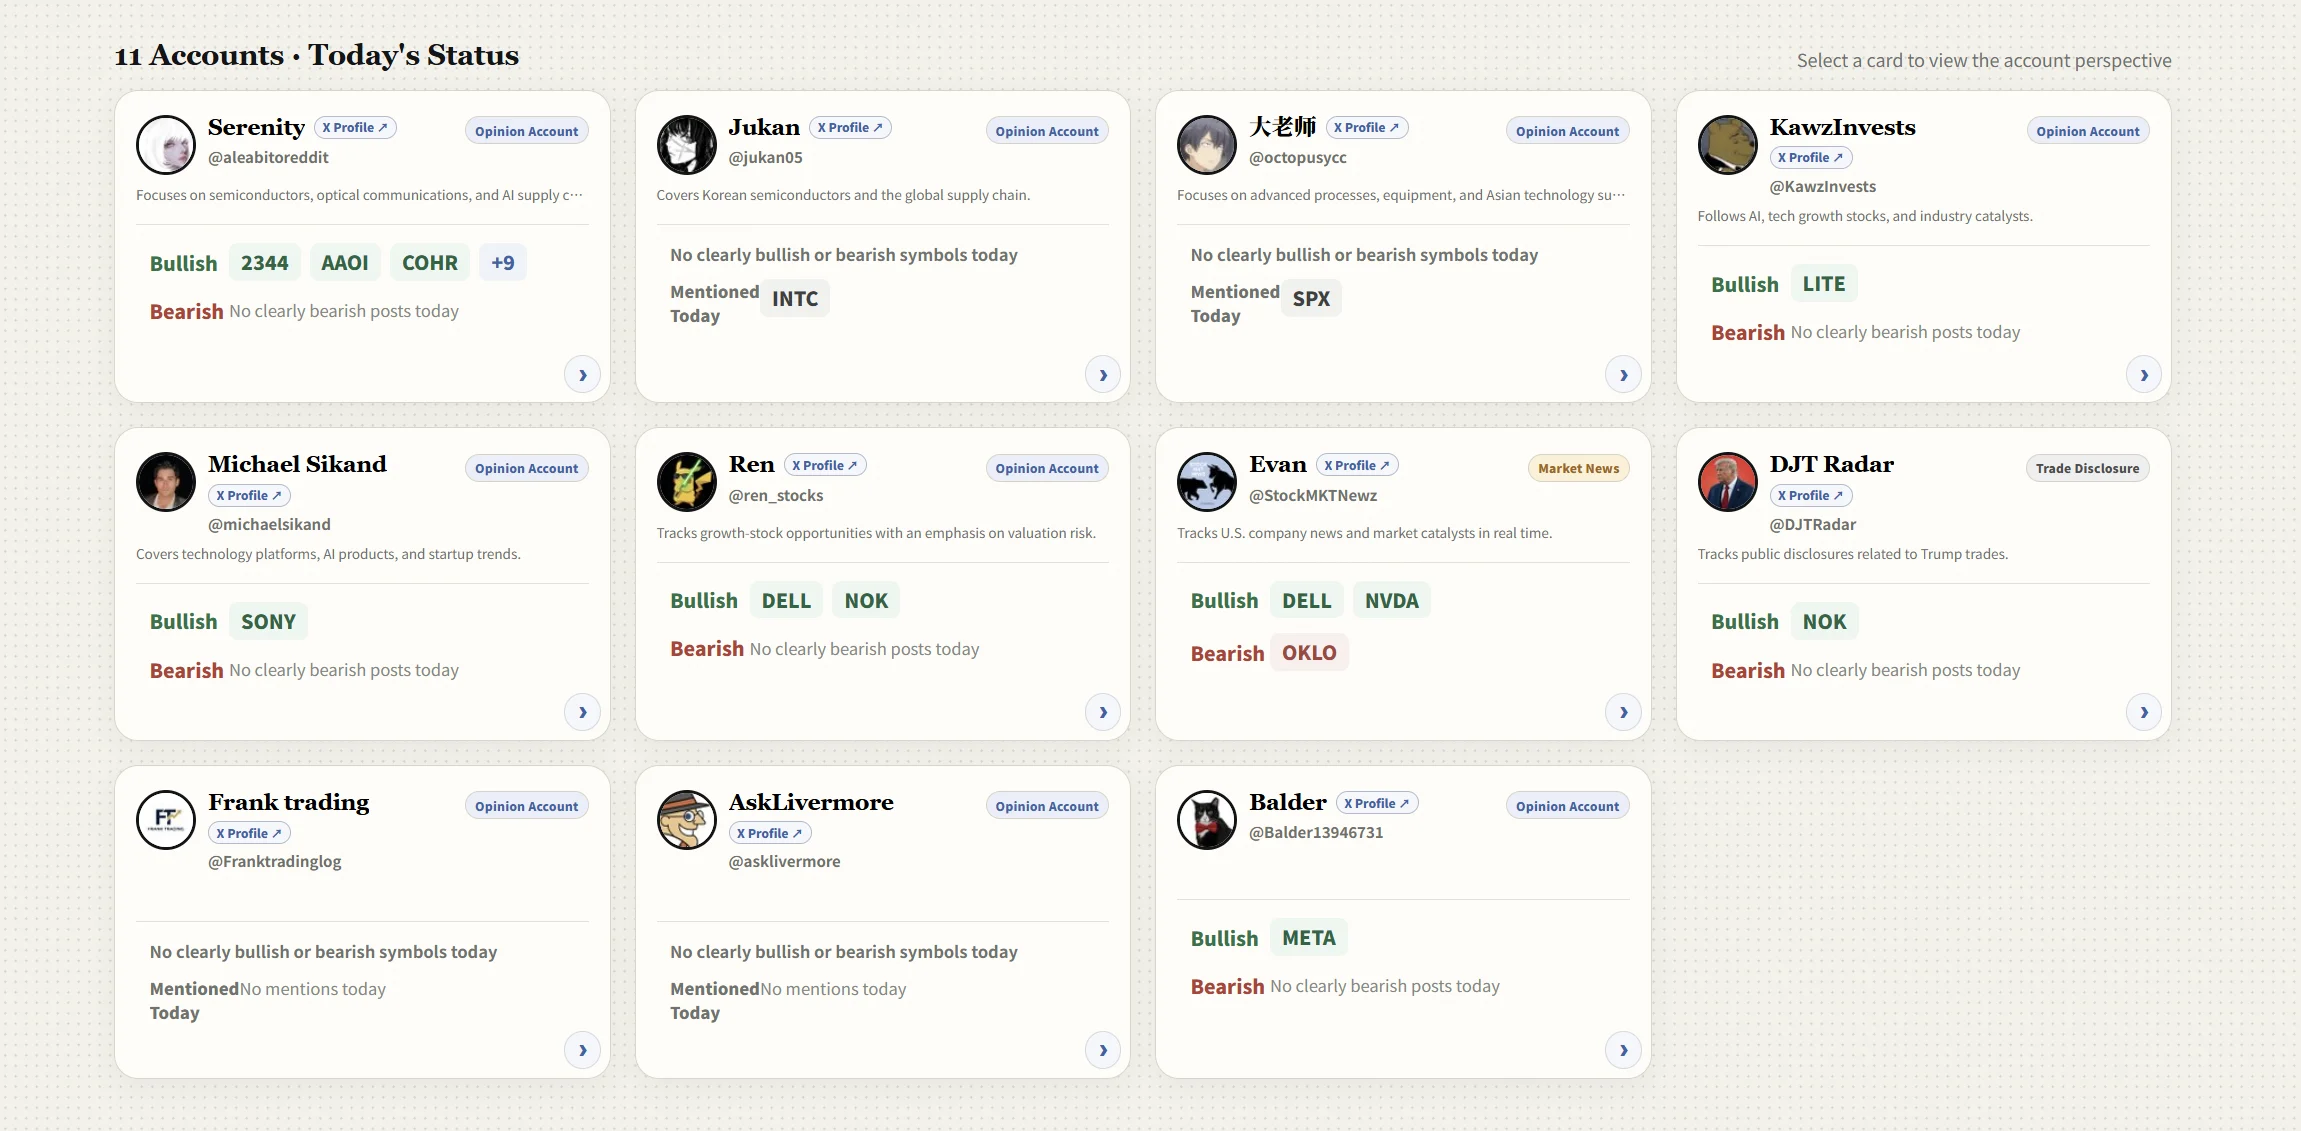
It goes beyond counting how often a stock is mentioned. It compares different accounts’ views, reasoning, and historical changes, helping you quickly understand:
- Which stocks are attracting more attention
- Which accounts are explicitly bullish or bearish
- Where different accounts agree or disagree on the same stock
- The original post, reasoning, and date behind each view
- How the market narrative around a stock has evolved over time
All content is sourced from public posts published by the tracked accounts.
📊 Market Consensus Dashboard
Simply say “Give me the Dashboard” to receive a self-contained HTML file that opens directly in your browser.
The Dashboard includes daily, weekly, and monthly views.
Daily
See the latest activity from all 10 tracked accounts, including:
- Stocks each account is explicitly bullish or bearish on, or has not expressed a clear stance on
- All stocks mentioned that day
- Clear shared bullish and bearish views
- Changes in market attention
- Important opinions with links to the original posts
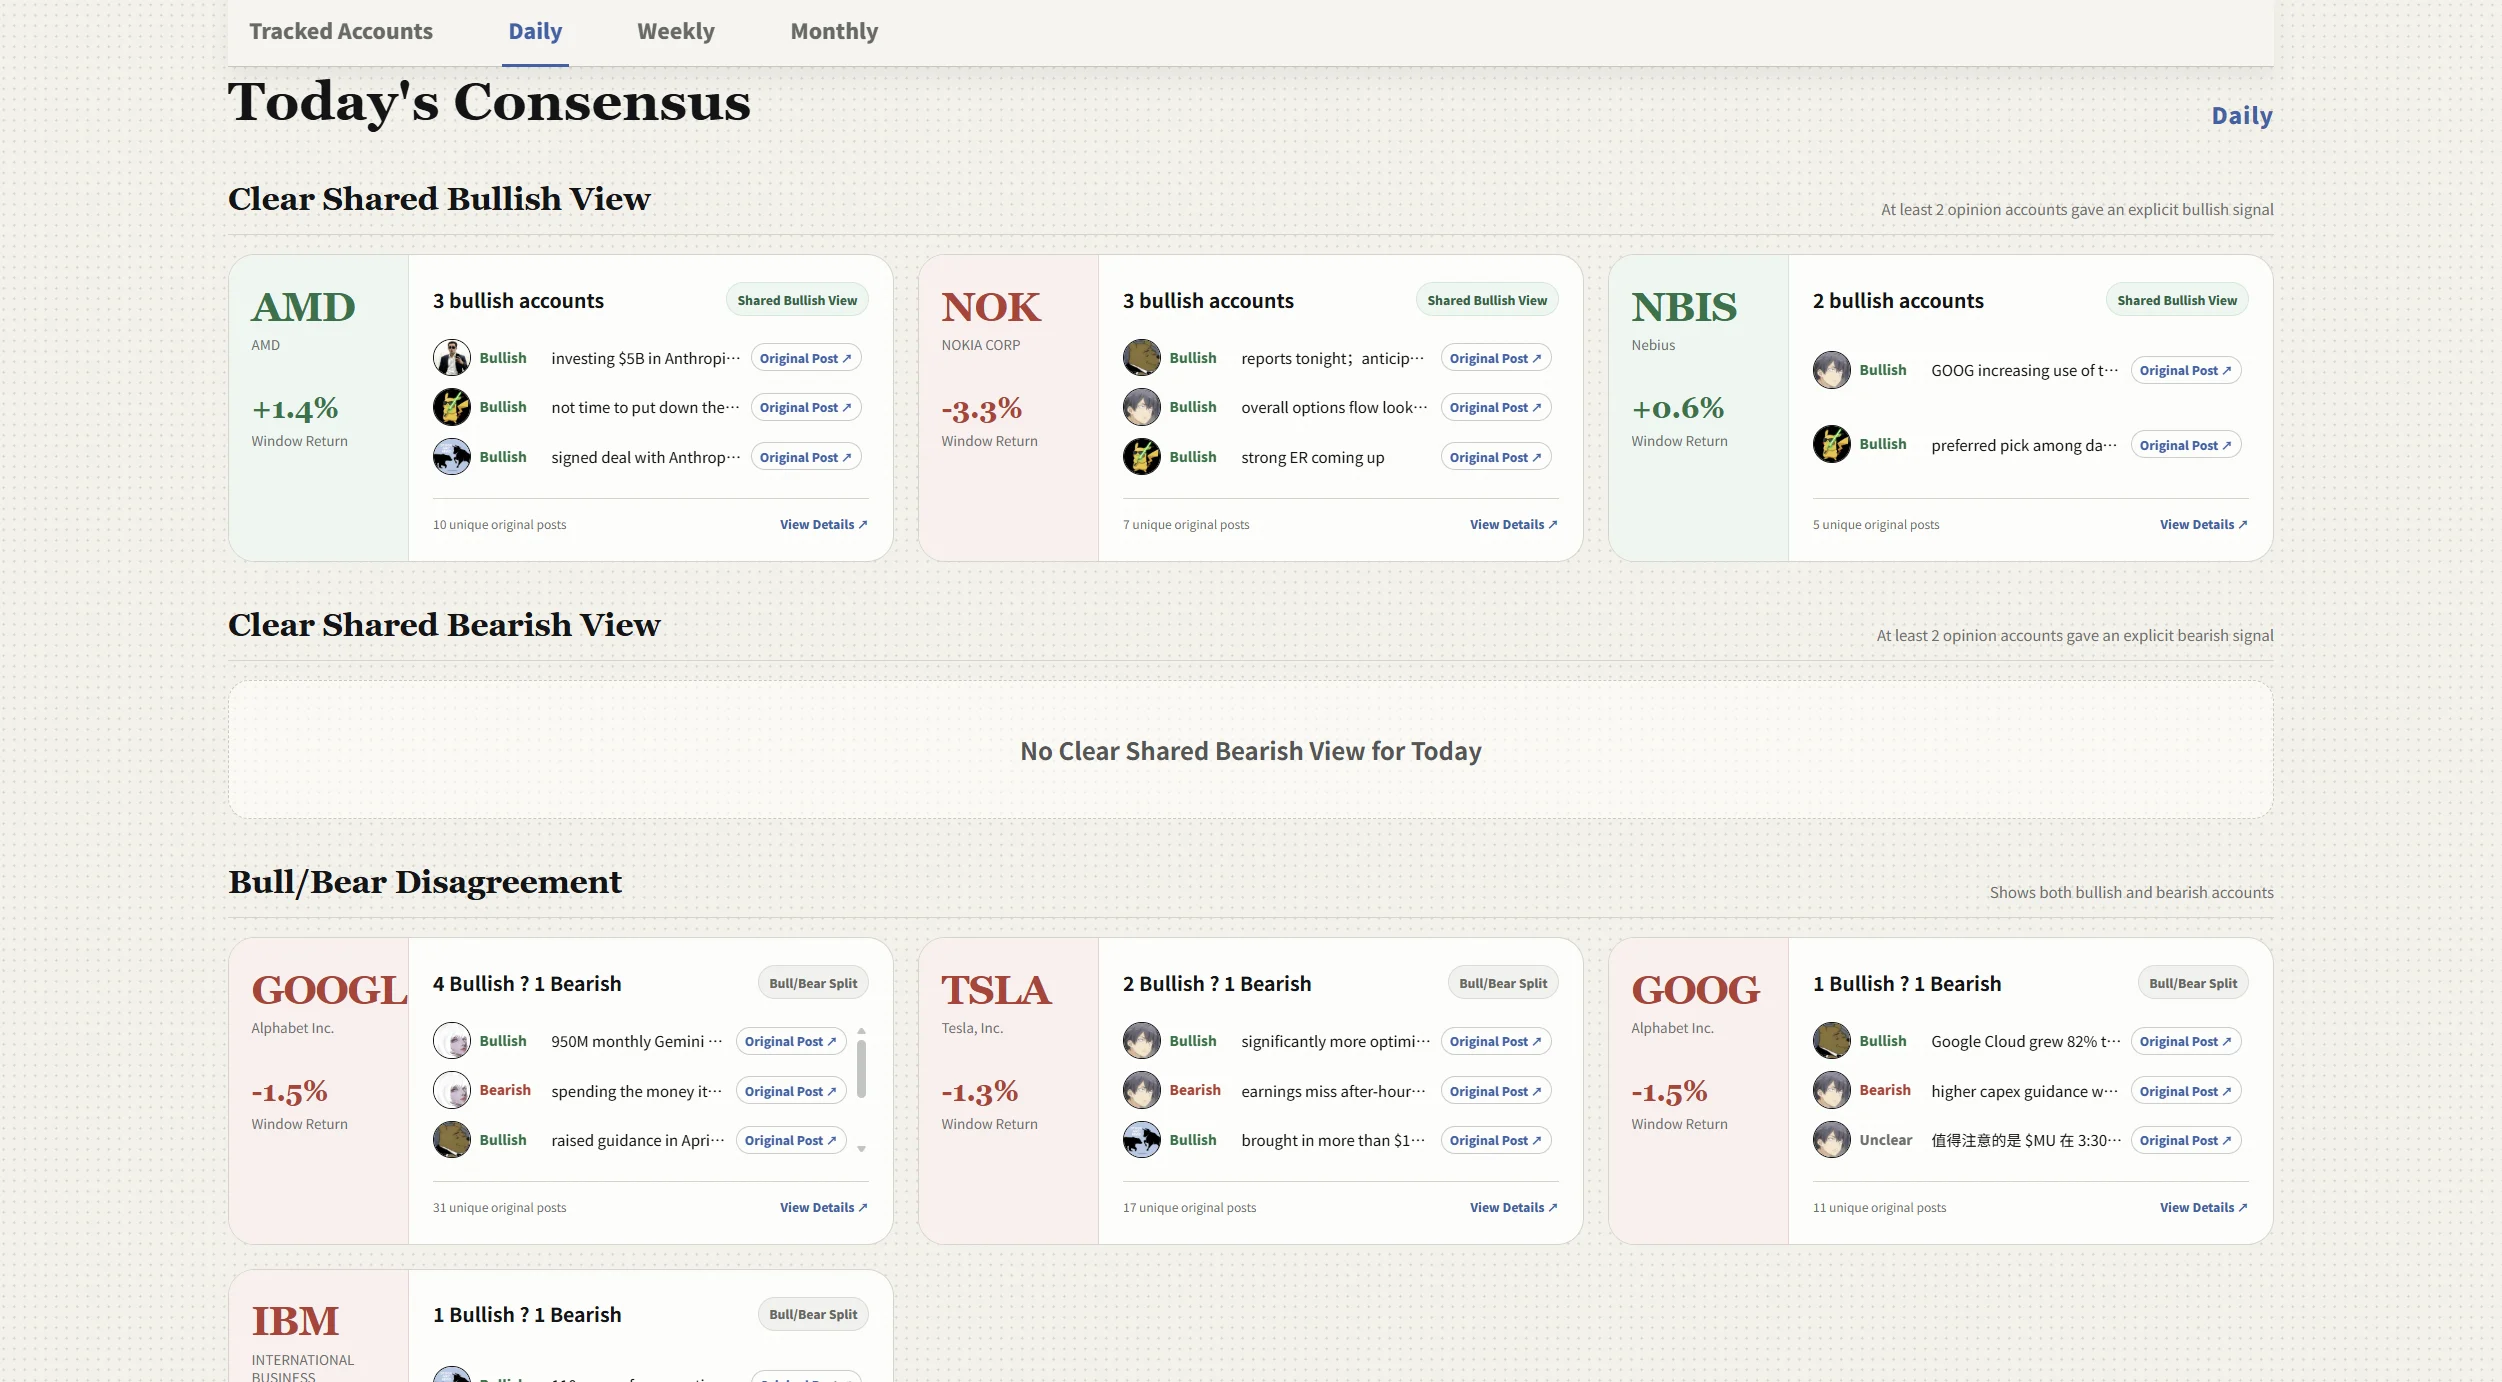
Each daily Dashboard also includes a brief market analysis highlighting the day’s most important areas of consensus, disagreement, and change.
If there is not enough meaningful data for the day, the analysis will combine today’s and the previous day’s data and clearly state the time range used.
Weekly
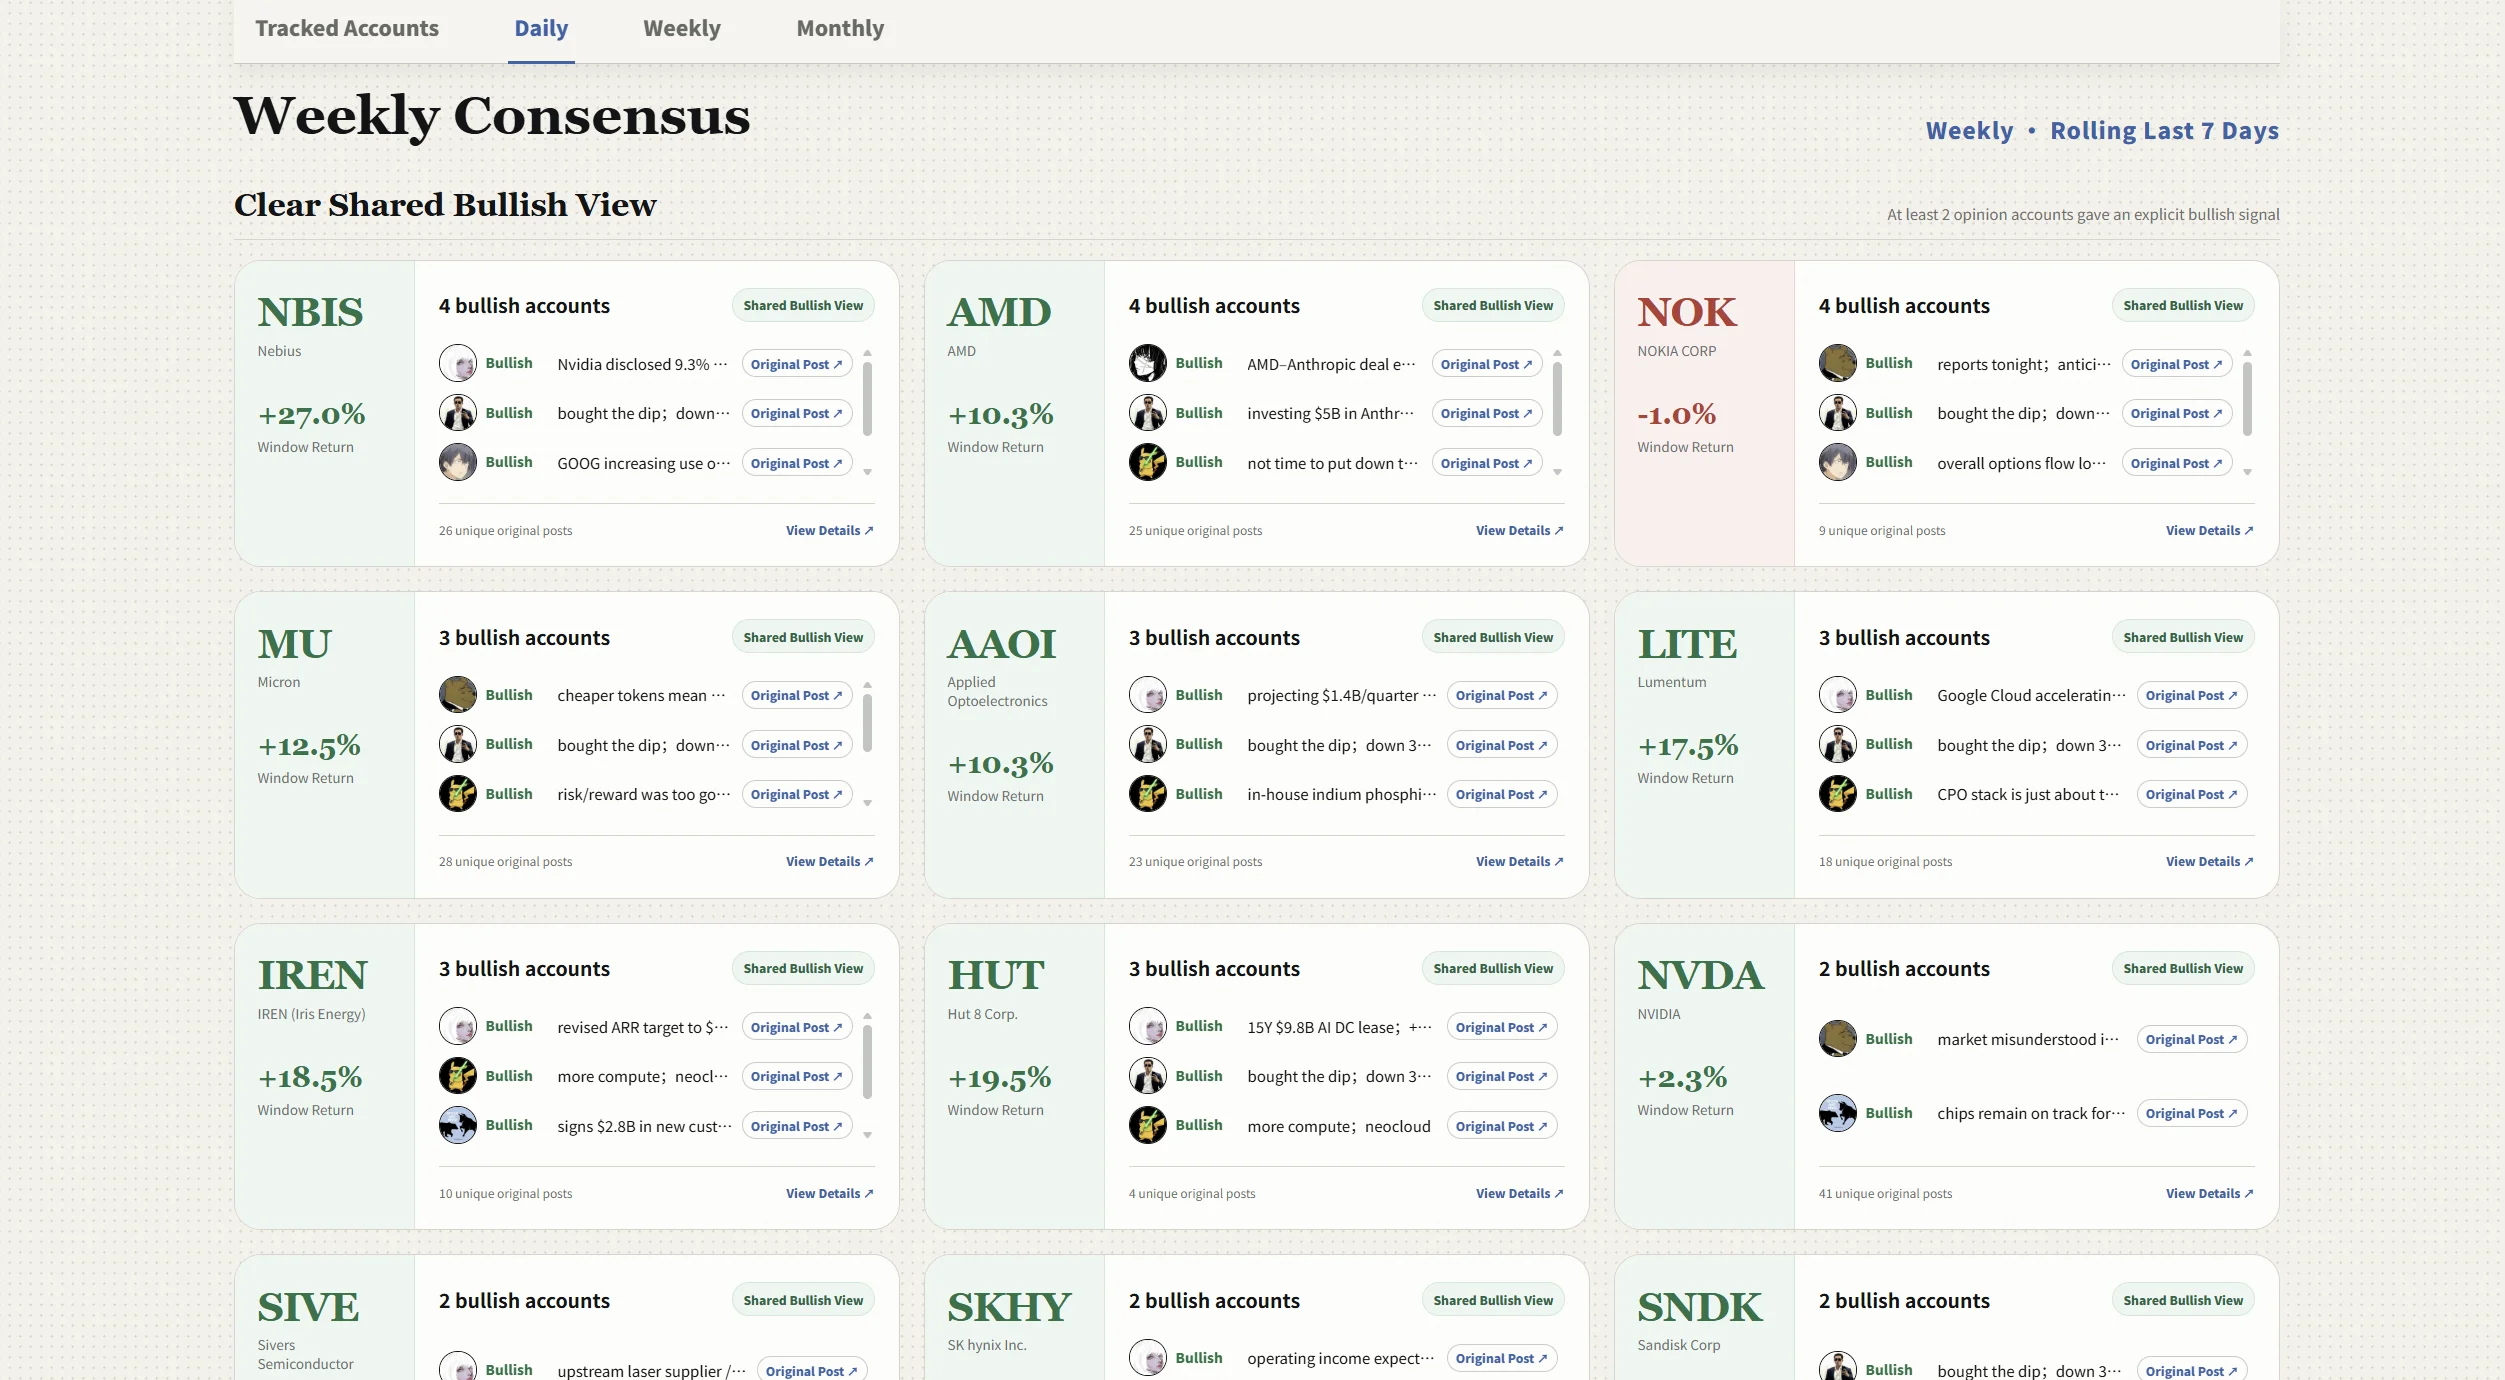
Summarize the latest 7 days to identify:
- Stocks receiving attention from multiple accounts
- Stocks with strong agreement or significant disagreement
- The distribution of bullish, bearish, and unclear views
- Changes in discussion activity and account opinions
- Each account’s main areas of focus during the week
Monthly
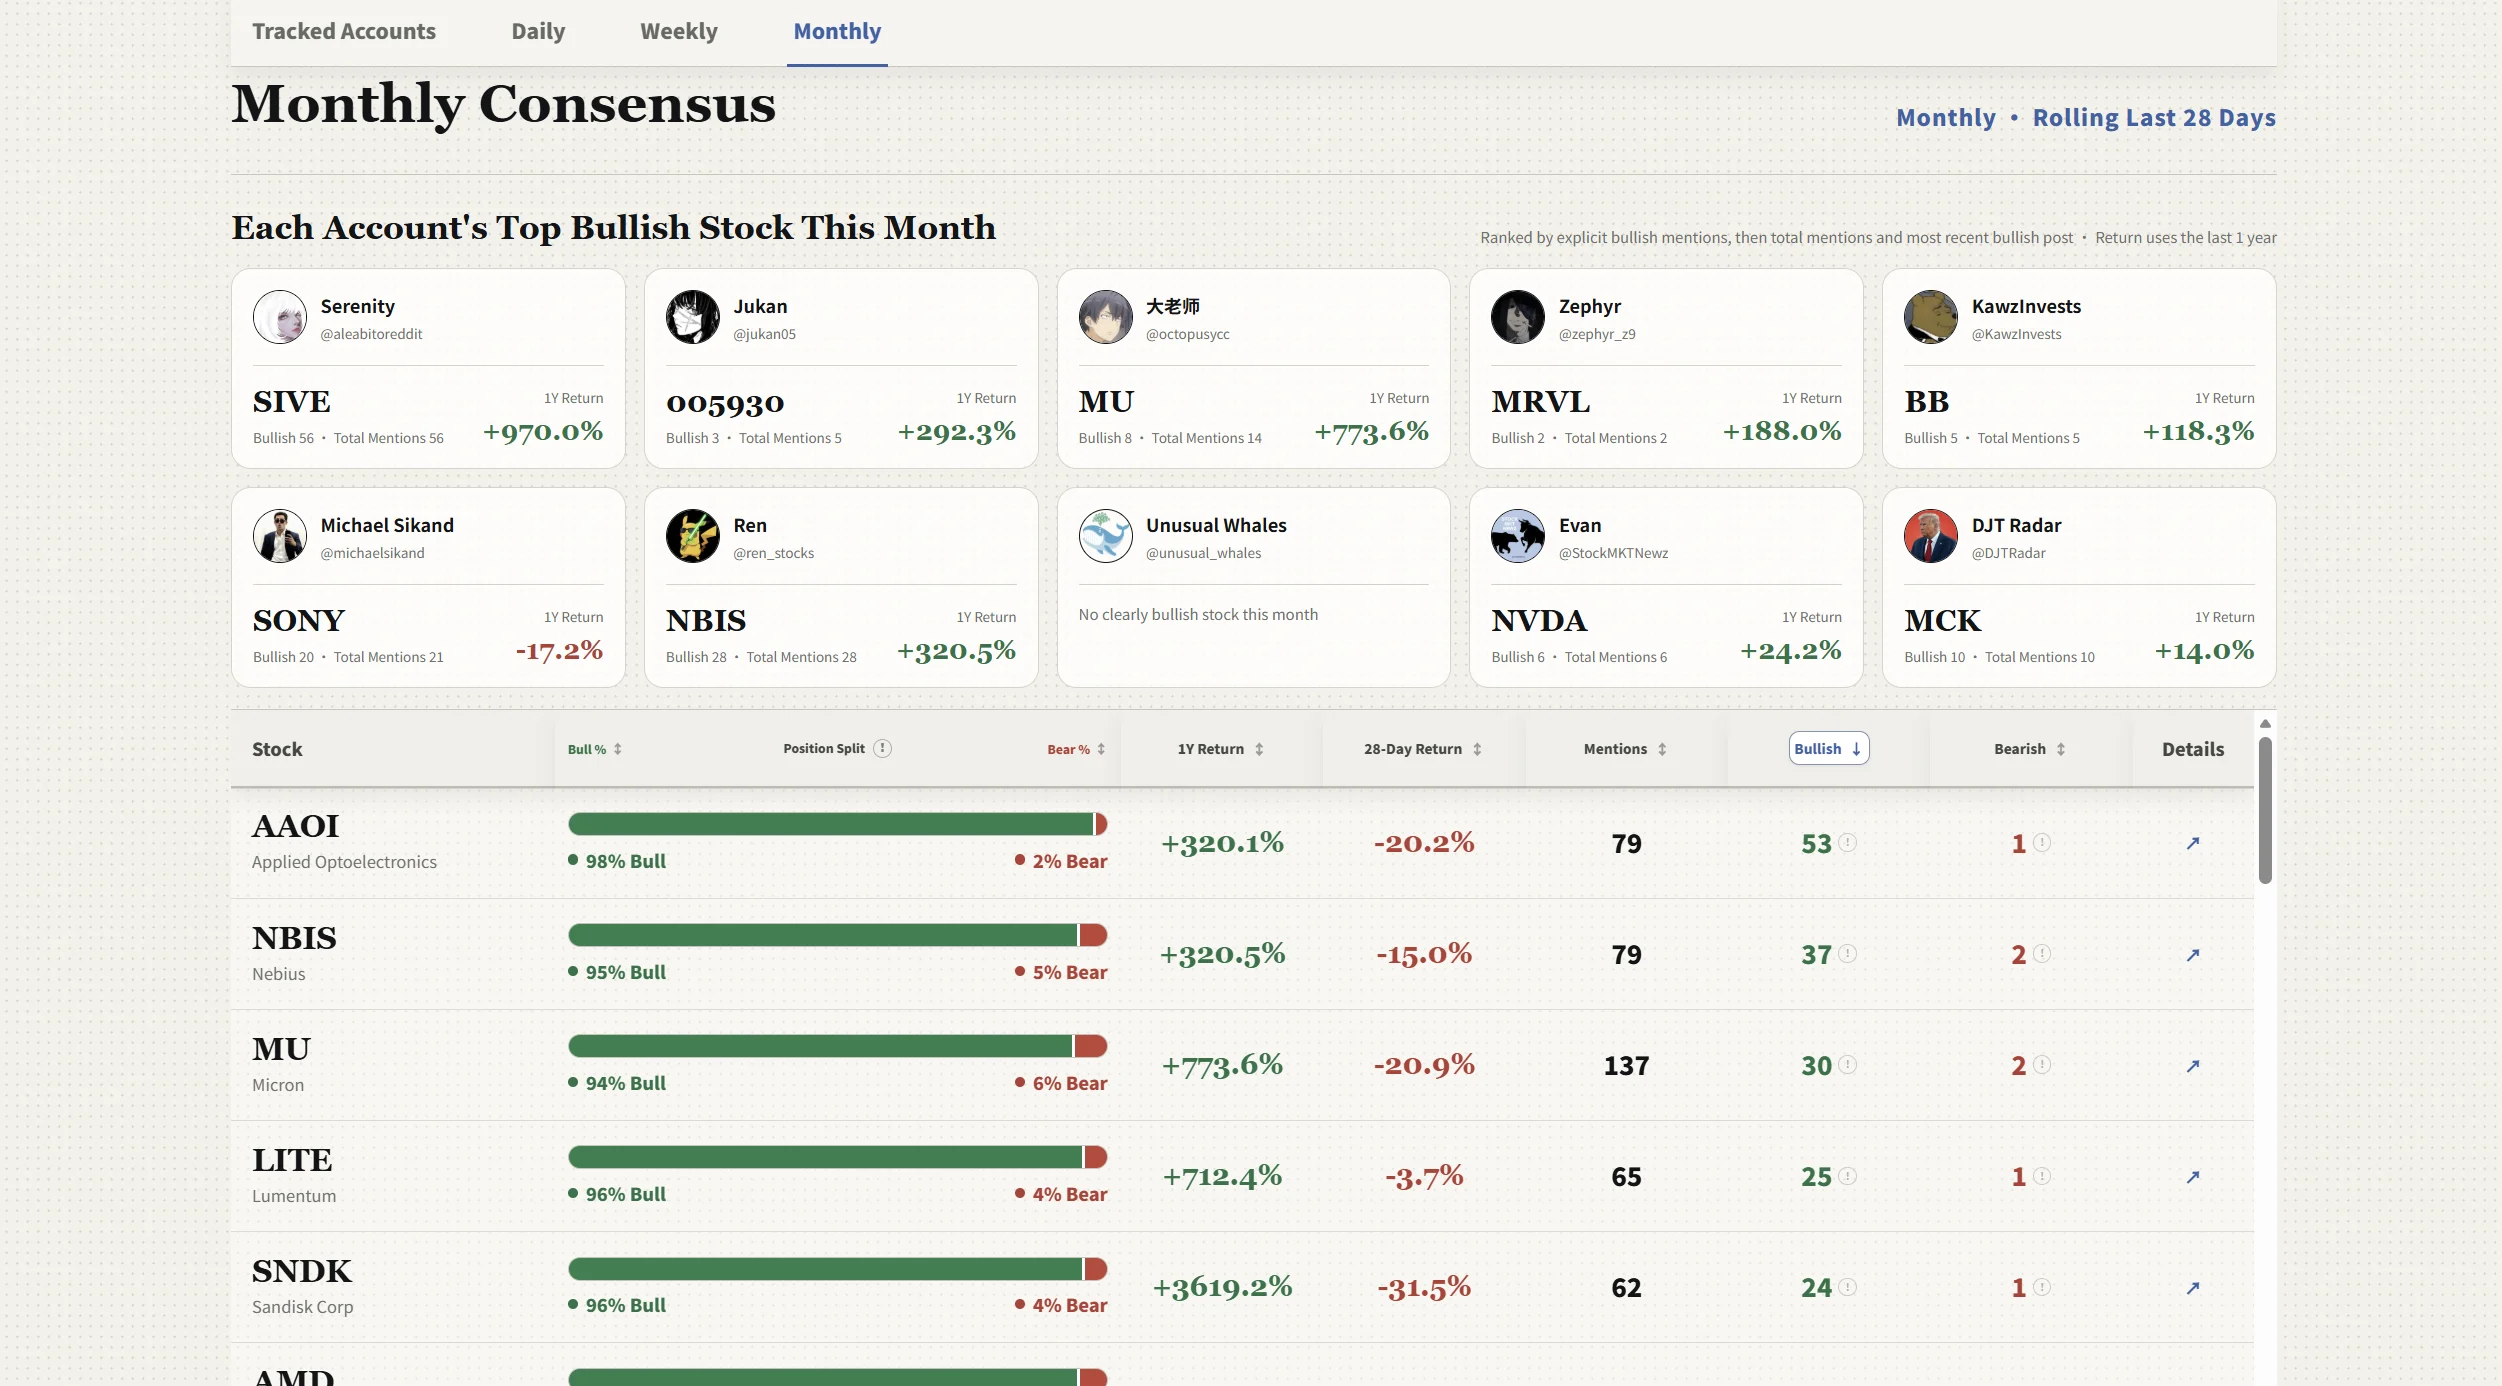
Summarize the latest 28 days to reveal broader market trends:
- Bullish and bearish opinion ratios
- Total mentions, bullish views, and bearish views
- One-year and 28-day price changes
- Account stance consistency
- Changes in stock attention and opinion over time
🔍 Stock Drill-Down Analysis
Select a stock in the Dashboard to open its complete drill-down page, including:
- Opinion distribution across tracked accounts
- Each account’s latest stance and reasoning
- The date and original post behind each view
- Areas of consensus and disagreement
- Historical opinion changes
- Important views and how they evolved
- The relationship between stock-price movements and key opinions
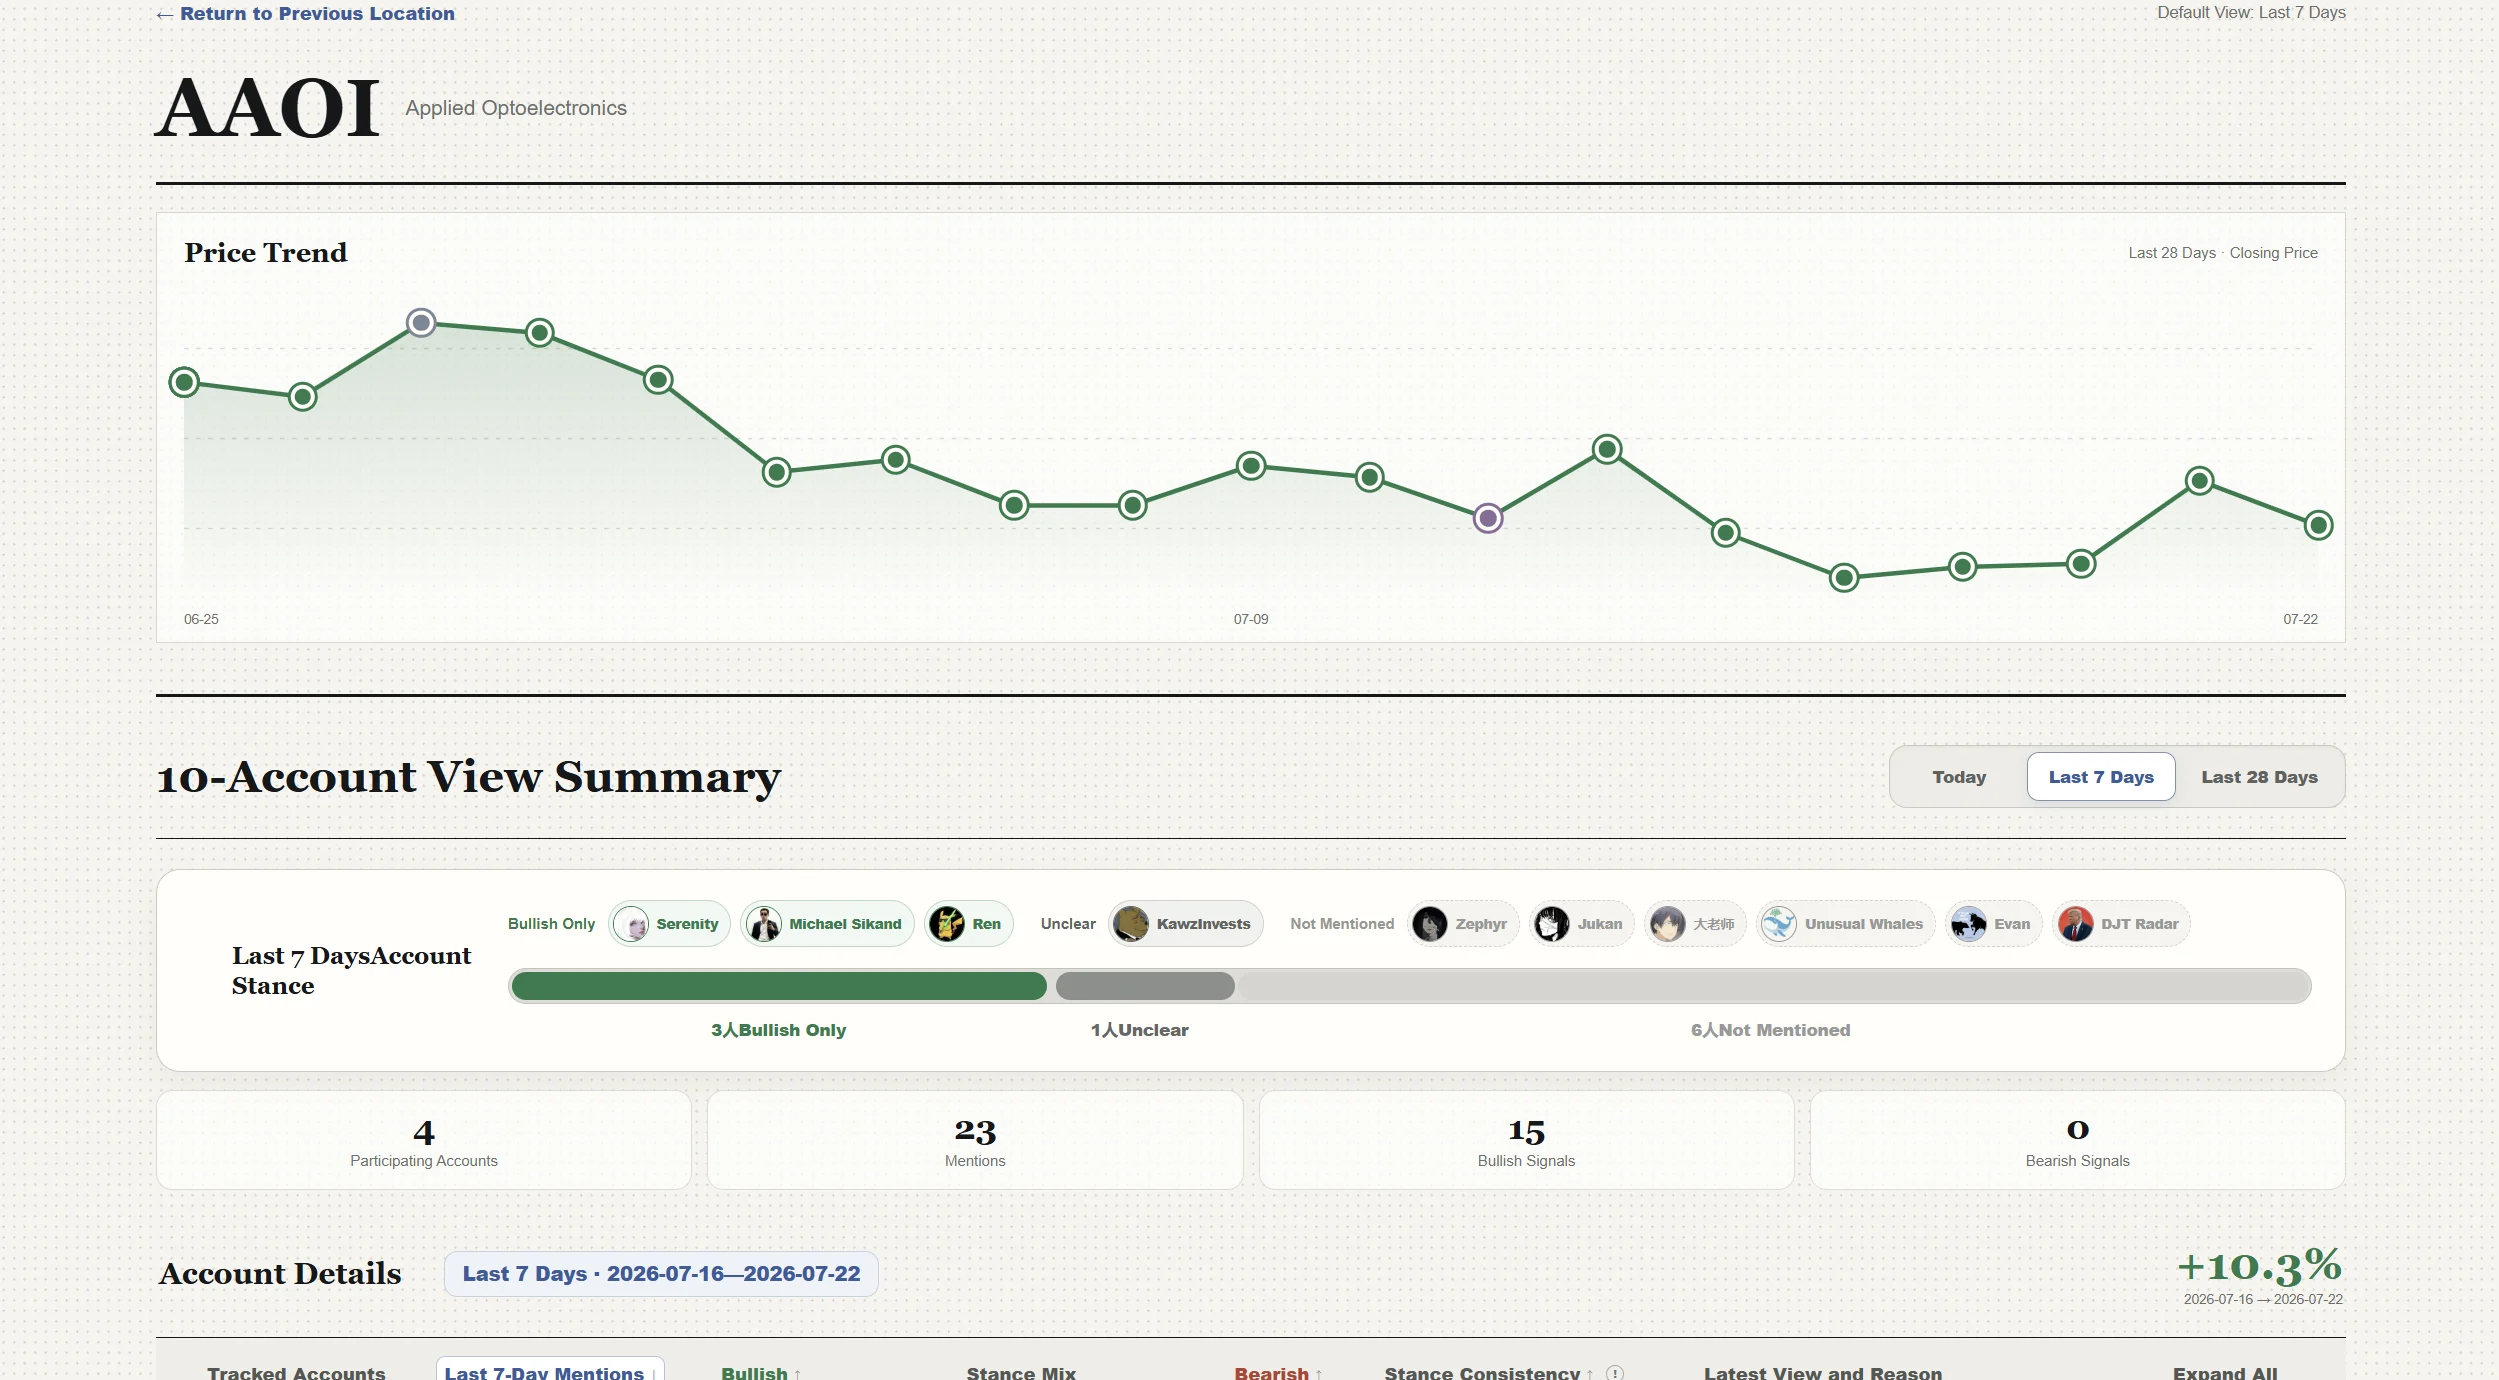
Historical data is used as context for understanding current views, rather than simply adding up past mentions.
Drill-down pages are not available in the platform preview. Download the HTML file and open it in your local browser to view the complete stock and account drill-down content.
🧠 AI-Powered Stock Q&A
You can also ask directly about any tracked stock, for example:
- “What does Serenity think about SIVE?”
- “Where do the 10 accounts agree or disagree on AAPL?”
- “Who is bullish on this stock, and what are their reasons?”
- “How have opinions on this stock changed recently?”
- “How do different accounts’ views on this stock compare?”
- “What are the main risks currently associated with this stock?”
- “Which historical views help explain the current outlook?”
Answers prioritize cross-account comparison instead of merely listing mention counts.
The analysis usually considers three time horizons:
- Current view: Each account’s latest explicit stance and reasoning.
- Recent changes: Whether a view has strengthened, weakened, reversed, or diverged.
- Historical context: How important past opinions help explain the current view.
If only a small number of accounts have expressed meaningful opinions, the response will clearly state the available evidence and will not treat accounts that never mentioned the stock as neutral.
🔄 Data Updates
Data is updated every 3 hours. The system checks for new remote data before generating each report and displays the data cutoff time.
⚠️ Important Disclaimer
Alpha Consensus is a public-information aggregation and research tool, not a financial advisor.
- All bullish, bearish, and unclear classifications are inferred by AI from the original posts and may be inaccurate
- Automatically generated reasoning, summaries, and cross-account analysis may contain errors or omissions
- Historical opinions may not represent an account’s current view
- Mention counts, consensus levels, and historical performance do not predict future returns
- This tool does not provide investment advice of any kind
- Always conduct your own research before making any decisions
External APIs
Github