Earnings Reaction Log — Beat but Dropped?
Read this first. This skill is a tool for logging how a stock reacted to its past earnings reports. It is not investment advice or a solicitation to trade, and it does not predict how the stock will move at the next report. You are responsible for your own investment decisions and their outcomes.
Good earnings, so why did the stock drop?
A headline says "EPS beats estimates!" and the next day the stock falls anyway. It happens more often than you'd think. Earnings Reaction Log walks through every past earnings report for a ticker and shows you, on a single card, how many times it beat estimates, how many times it dropped anyway, and the average percent it moved.

A demo built from real output. Tickers are examples, not recommendations.
How to use it
Just tell your agent, "Show me how NVDA, TSLA, and AAPL moved around their earnings reports."
uv run scripts/earnings_move.py NVDA TSLA AAPL
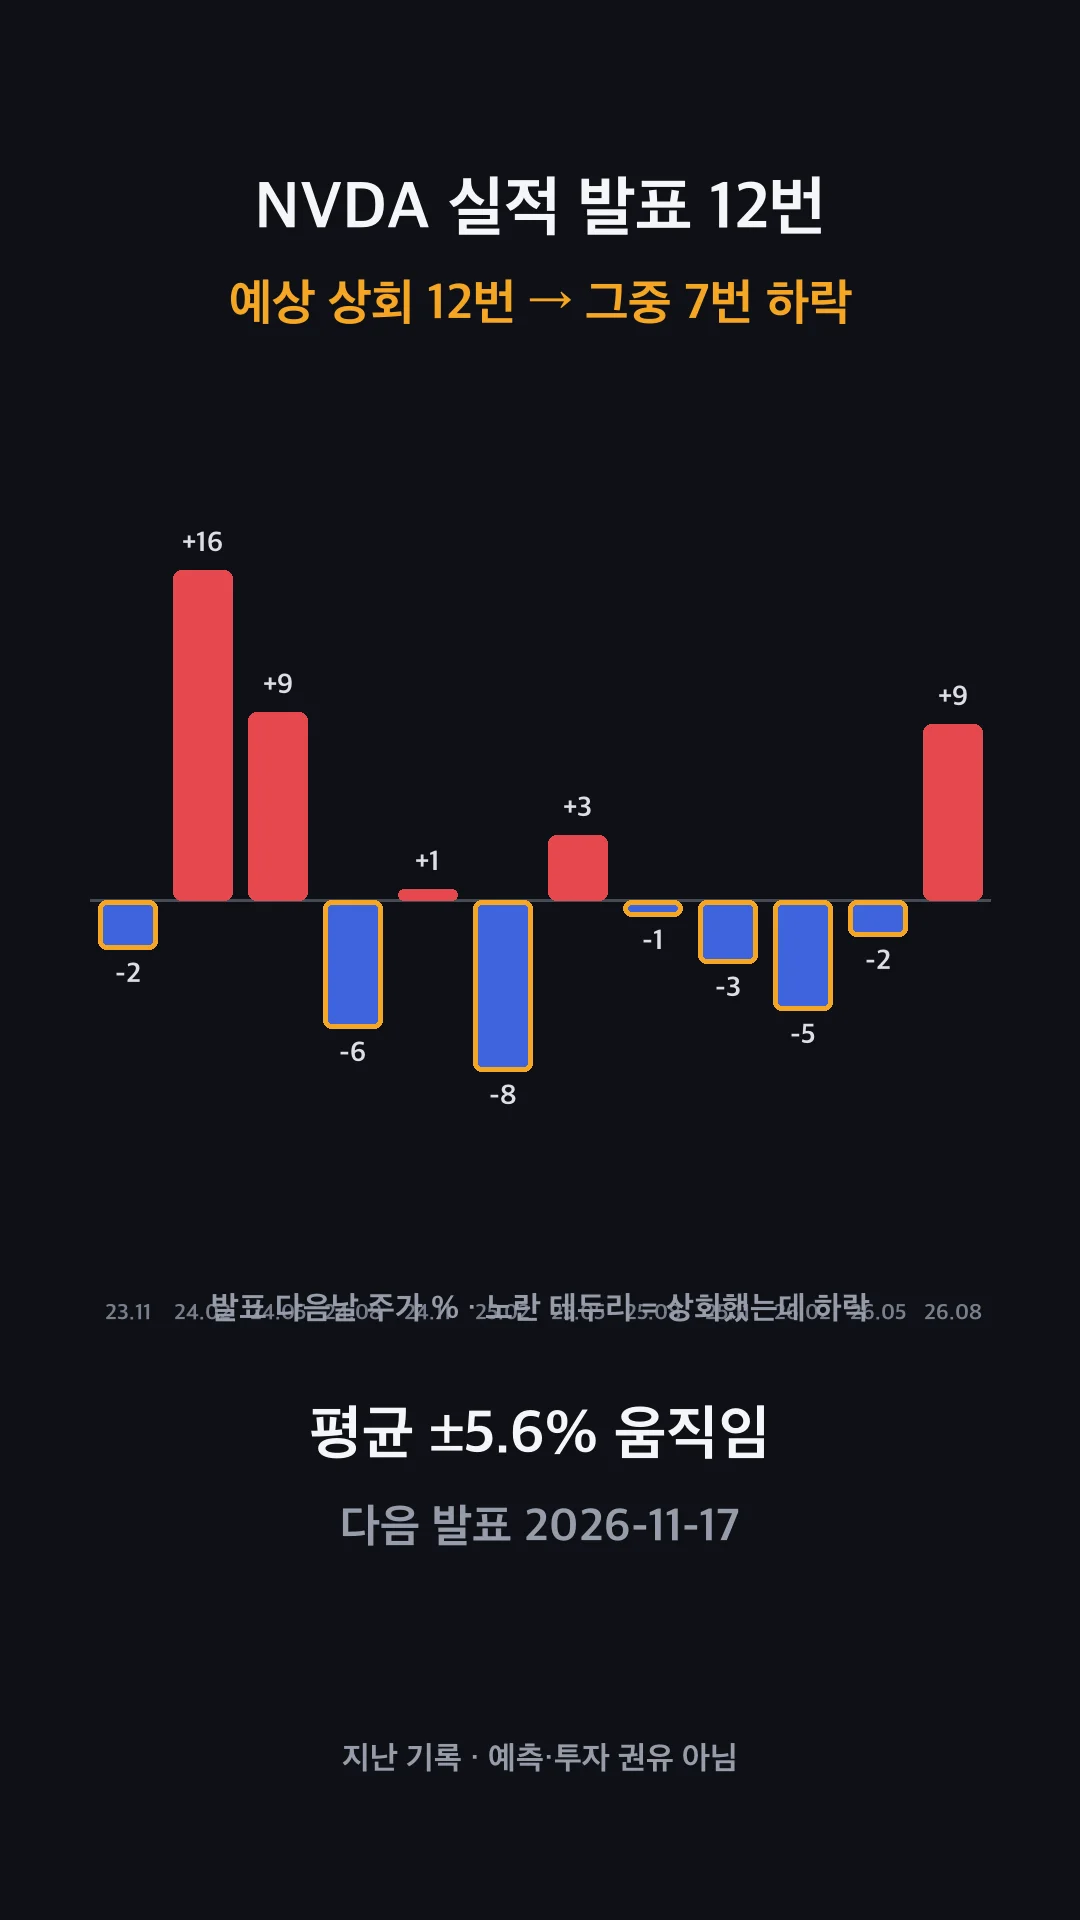
NVDA's last 12 reports: it beat EPS estimates all 12 times, and on 7 of them the stock fell the next day (yellow border).
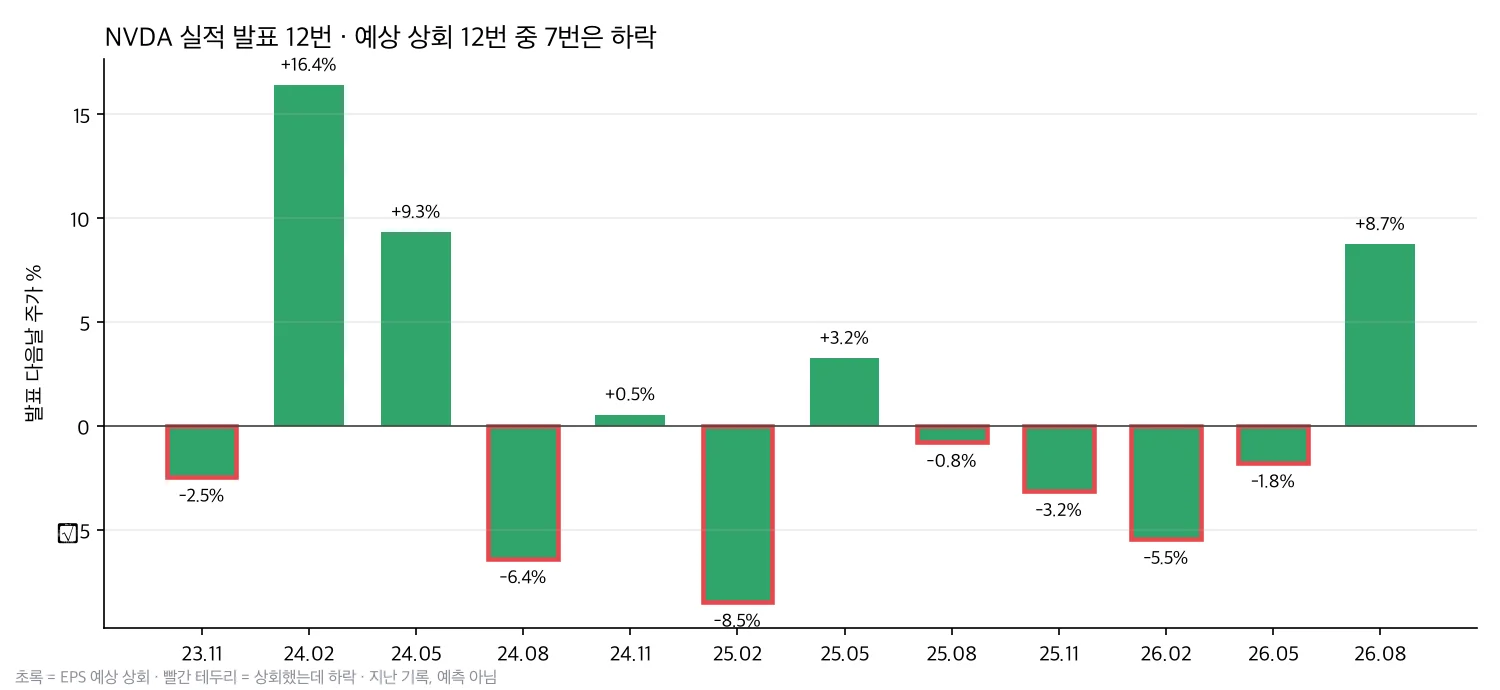
Next-day move for each report. Green is a beat; a red border means it beat but still dropped.
What you get
| Output | What it includes |
|---|---|
| Summary table | Records per ticker, beats, beat-but-dropped count, next-day gains, average move, biggest gain and drop, next earnings date |
| Per-report table | Report date, before open / after close, EPS estimate / actual / surprise, gap, next day, 5-day |
| Charts | A bar chart per ticker and a shareable 9:16 card |
What's inside
| File | What it does |
|---|---|
SKILL.md |
The procedure and the rules the agent follows (no predictions, no trade solicitations) |
scripts/earnings_move.py |
The logger (report, charts, card, JSON) |
DISCLAIMER.md |
The notice to read before use |
What this skill won't do
- Answer "should I buy for this earnings?" or predict the next reaction. Past records don't tell you what happens next.
- Korean stocks. Free data has spotty earnings calendars, so only US stocks are supported.
Requirements
uvand an internet connection. It uses yfinance's free data, so no API key is needed. Because that data is unofficial, a wrong report time can shift the reaction day by one.
Want it without installing anything? Look for "Stock Account Assistant" on Capafy. It's a subscription agent that runs this and seven other tools right from chat.
Disclaimer This skill and its output are informational calculations on historical data, not investment advice or a solicitation. Accuracy of the data is not guaranteed. You are solely responsible for your investment decisions and their outcomes, and the author accepts no legal liability for investment losses based on them, to the extent permitted by applicable law.
External APIs
yfinance