

Trading Crypto Support Monitor
📊 Trading Crypto Support Monitor
See what the crypto market is doing — without the noise.
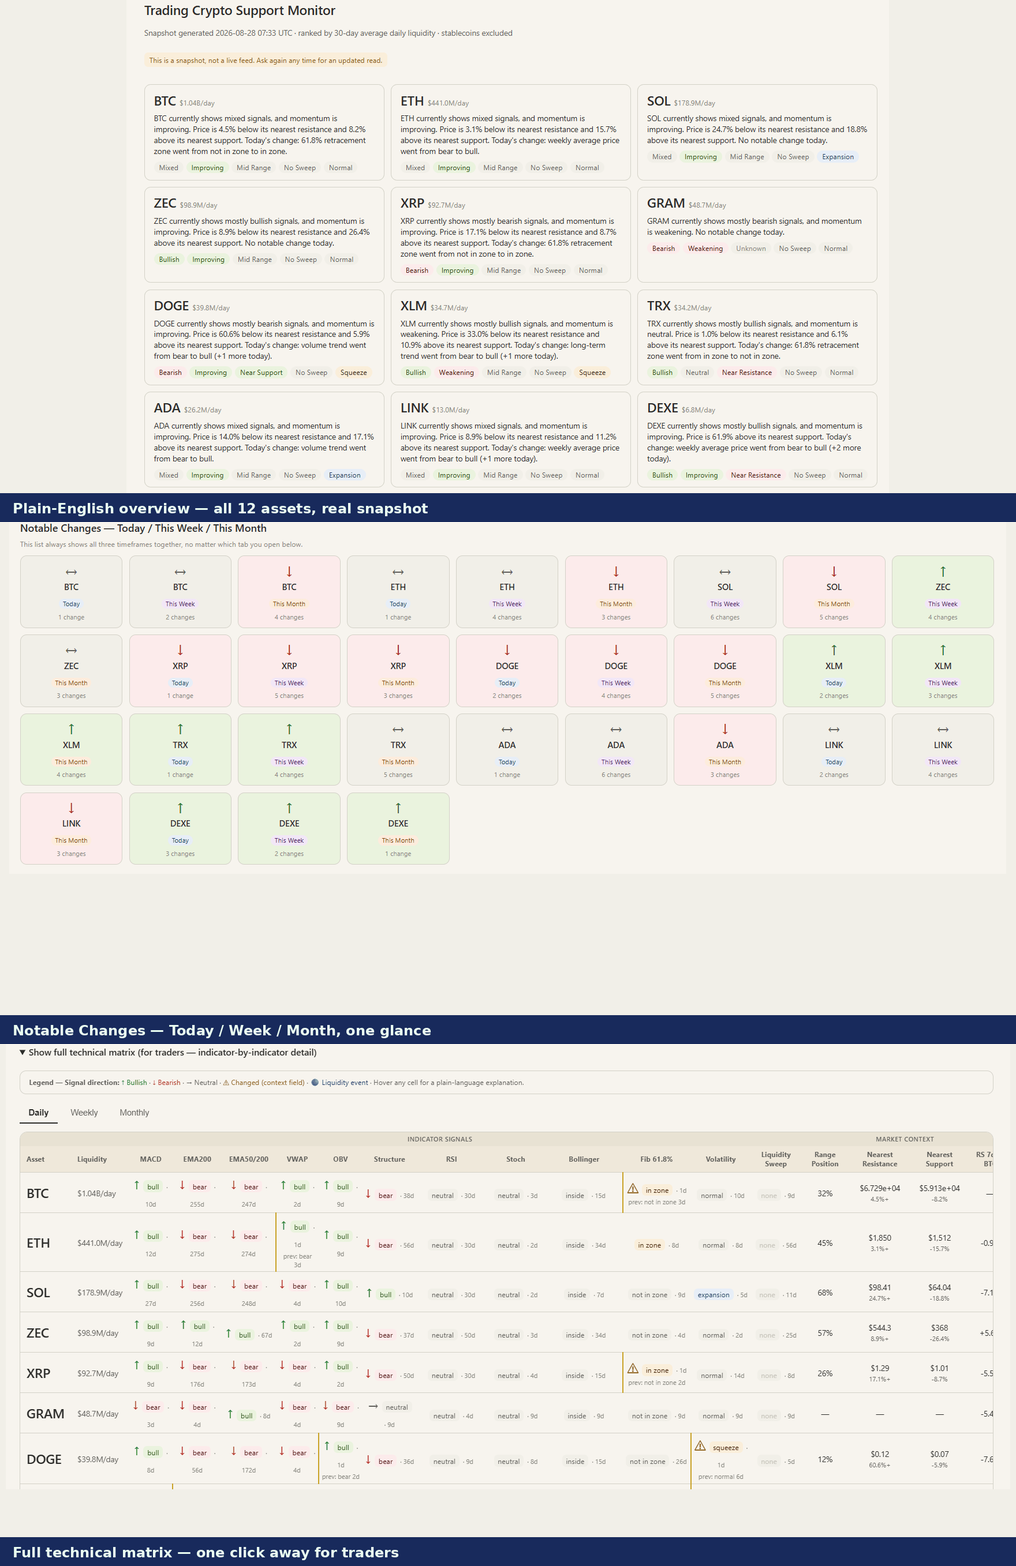 ` right here, at the top of the Details section, before any text below. Visitors should see the product before they read about it.)
Curious what's happening across the crypto market right now? 👀 Ask for "today's market matrix" and get a clean, visual snapshot of 12 tracked crypto assets — explained in plain English, with the deeper technical detail available whenever you want it.
No hype. No "buy now" signals. No mysterious AI guesses. Just a structured look at what the data is actually saying. 🔎
🚀 What you get
💬 1. A simple market summary. Instead of a wall of indicators, each asset gets an easy-to-read card: trend, momentum, price position versus its nearest support/resistance, current volatility state, and its liquidity ranking and 30-day average daily dollar volume. If something notable happened today, the card says so in one plain sentence. You don't need to know what "EMA200" means to read the first screen.
🔄 2. See what changed — Today / This Week / This Month, at a glance. Every box shows an arrow: ↑ means the overall trend read is currently bullish, ↓ means it's currently bearish, ↔ means the trend picture is mixed right now. That arrow reflects the overall trend bias, not "how big" the change was — so a ↔ box can still hold a real, worth-knowing change (say, an RSI shift or a volatility squeeze) that just doesn't move the broader trend needle. Hover any box for the exact "was X, now Y" detail. 👀
🧠 3. Go deeper when you want to. One click opens the full technical matrix: MACD, RSI, EMA200, EMA50/200 cross, VWAP, OBV, market structure, Bollinger Bands, Fibonacci 61.8%, volatility, and liquidity sweeps — for all 12 assets. Simple answer first, technical detail on demand. No information overload. 🙌
📅 4. Daily, Weekly & Monthly perspective. All built from the same daily data: Daily is the latest reading, Weekly is a 7-day majority rollup, Monthly is a 28-day majority rollup — so you can tell "something changed today" apart from "something has been building for weeks." These aren't separate weekly/monthly-candle calculations, just different windows over the same daily numbers.
🧪 5. Historical research context, clearly separated. Where independent backtest results are available, the dashboard shows a Profit Factor (profits vs. losses in that backtest) and Win Rate — kept visually separate from today's live reading. One concept (EMA50/200 cross, also known as the golden/death cross) hasn't been independently tested yet and is labeled "Not yet tested." Two others (Volatility, Liquidity Sweep) are descriptive concepts rather than standalone entry/exit signals, so no Profit Factor applies to them by design. We don't fill any of these gaps with impressive-looking made-up numbers.
🪙 Assets covered
BTC · ETH · SOL · ZEC · XRP · DOGE · XLM · TRX · ADA · GRAM · LINK · DEXE — 12 tracked crypto assets (a fixed v1 list, not a claim these are "the" 12 biggest), automatically ranked by their 30-day average daily dollar volume, recalculated fresh on every run. Stablecoins are intentionally excluded from the v1 asset universe. This is a crypto-only monitor — it does not cover stocks, forex, or commodities.
🛡️ What this is NOT
🚫 Not financial advice. The monitor describes technical conditions — never a buy recommendation, sell recommendation, price target, or stop-loss suggestion. If you want a signal telling you what trade to take, this isn't that product. If you want a clear, honest picture of what the market currently looks like, that's exactly what it's built for.
⏱️ Not a live ticker. It doesn't stream prices in the background. Every request generates a fresh snapshot from that moment's market data — "show me the market now," not "keep updating my screen."
🔍 Not a black box. Every number comes from a documented, deterministic calculation, never a language-model guess — the AI only presents the results, it never invents them. Untested concepts are labeled honestly instead of hidden or faked.
⚙️ How it works
1️⃣ Pulls public price/volume data (Binance's public feed — no account, no personal data)
2️⃣ Runs it through documented technical-analysis formulas
3️⃣ Classifies each asset's current state, concept by concept
4️⃣ Compares today's state against prior readings to catch what changed
5️⃣ Assembles the visual market matrix
6️⃣ Hands you the dashboard, plus a short plain-English summary in chat
🎯 Who it's for
- 👀 Anyone who wants a fast, structured check-in across several crypto assets at once
- 📊 People who like technical analysis but don't want to manually open a chart per indicator per coin
- 🧠 Anyone who'd rather read plain English first and drill into indicators only when curious
- 📅 Anyone who wants to tell a one-day blip apart from a multi-week shift
- 🛡️ Anyone who prefers descriptive market information over aggressive trading signals
❤️ The idea behind it
See the market clearly before deciding what it means to you. This monitor isn't here to tell you what to trade — it's here to make the market easier to observe, understand, and investigate. Clear. Structured. Data-driven. No hype. 🚀
External APIs
Binance public REST API


