

Unison — Congress & White House Stock Tracker
📡 Official Disclosure Records
Unison reads the latest published snapshot of U.S. financial disclosures and turns it into a structured dashboard.
- Who disclosed a trade in a security, and in which direction
- Securities that drew several officials in the same 30- or 90-day window
- The disclosed amount band, transaction date, and filing date behind every record
- How many days each filing lagged the trade it reports
- The official source link behind each record
Every row comes from an official disclosure filing. Nothing is inferred from news, social posts, or estimates.
📊 The Dashboard
Ask for the dashboard and you get a self-contained HTML file that opens in any browser — no account, no install.
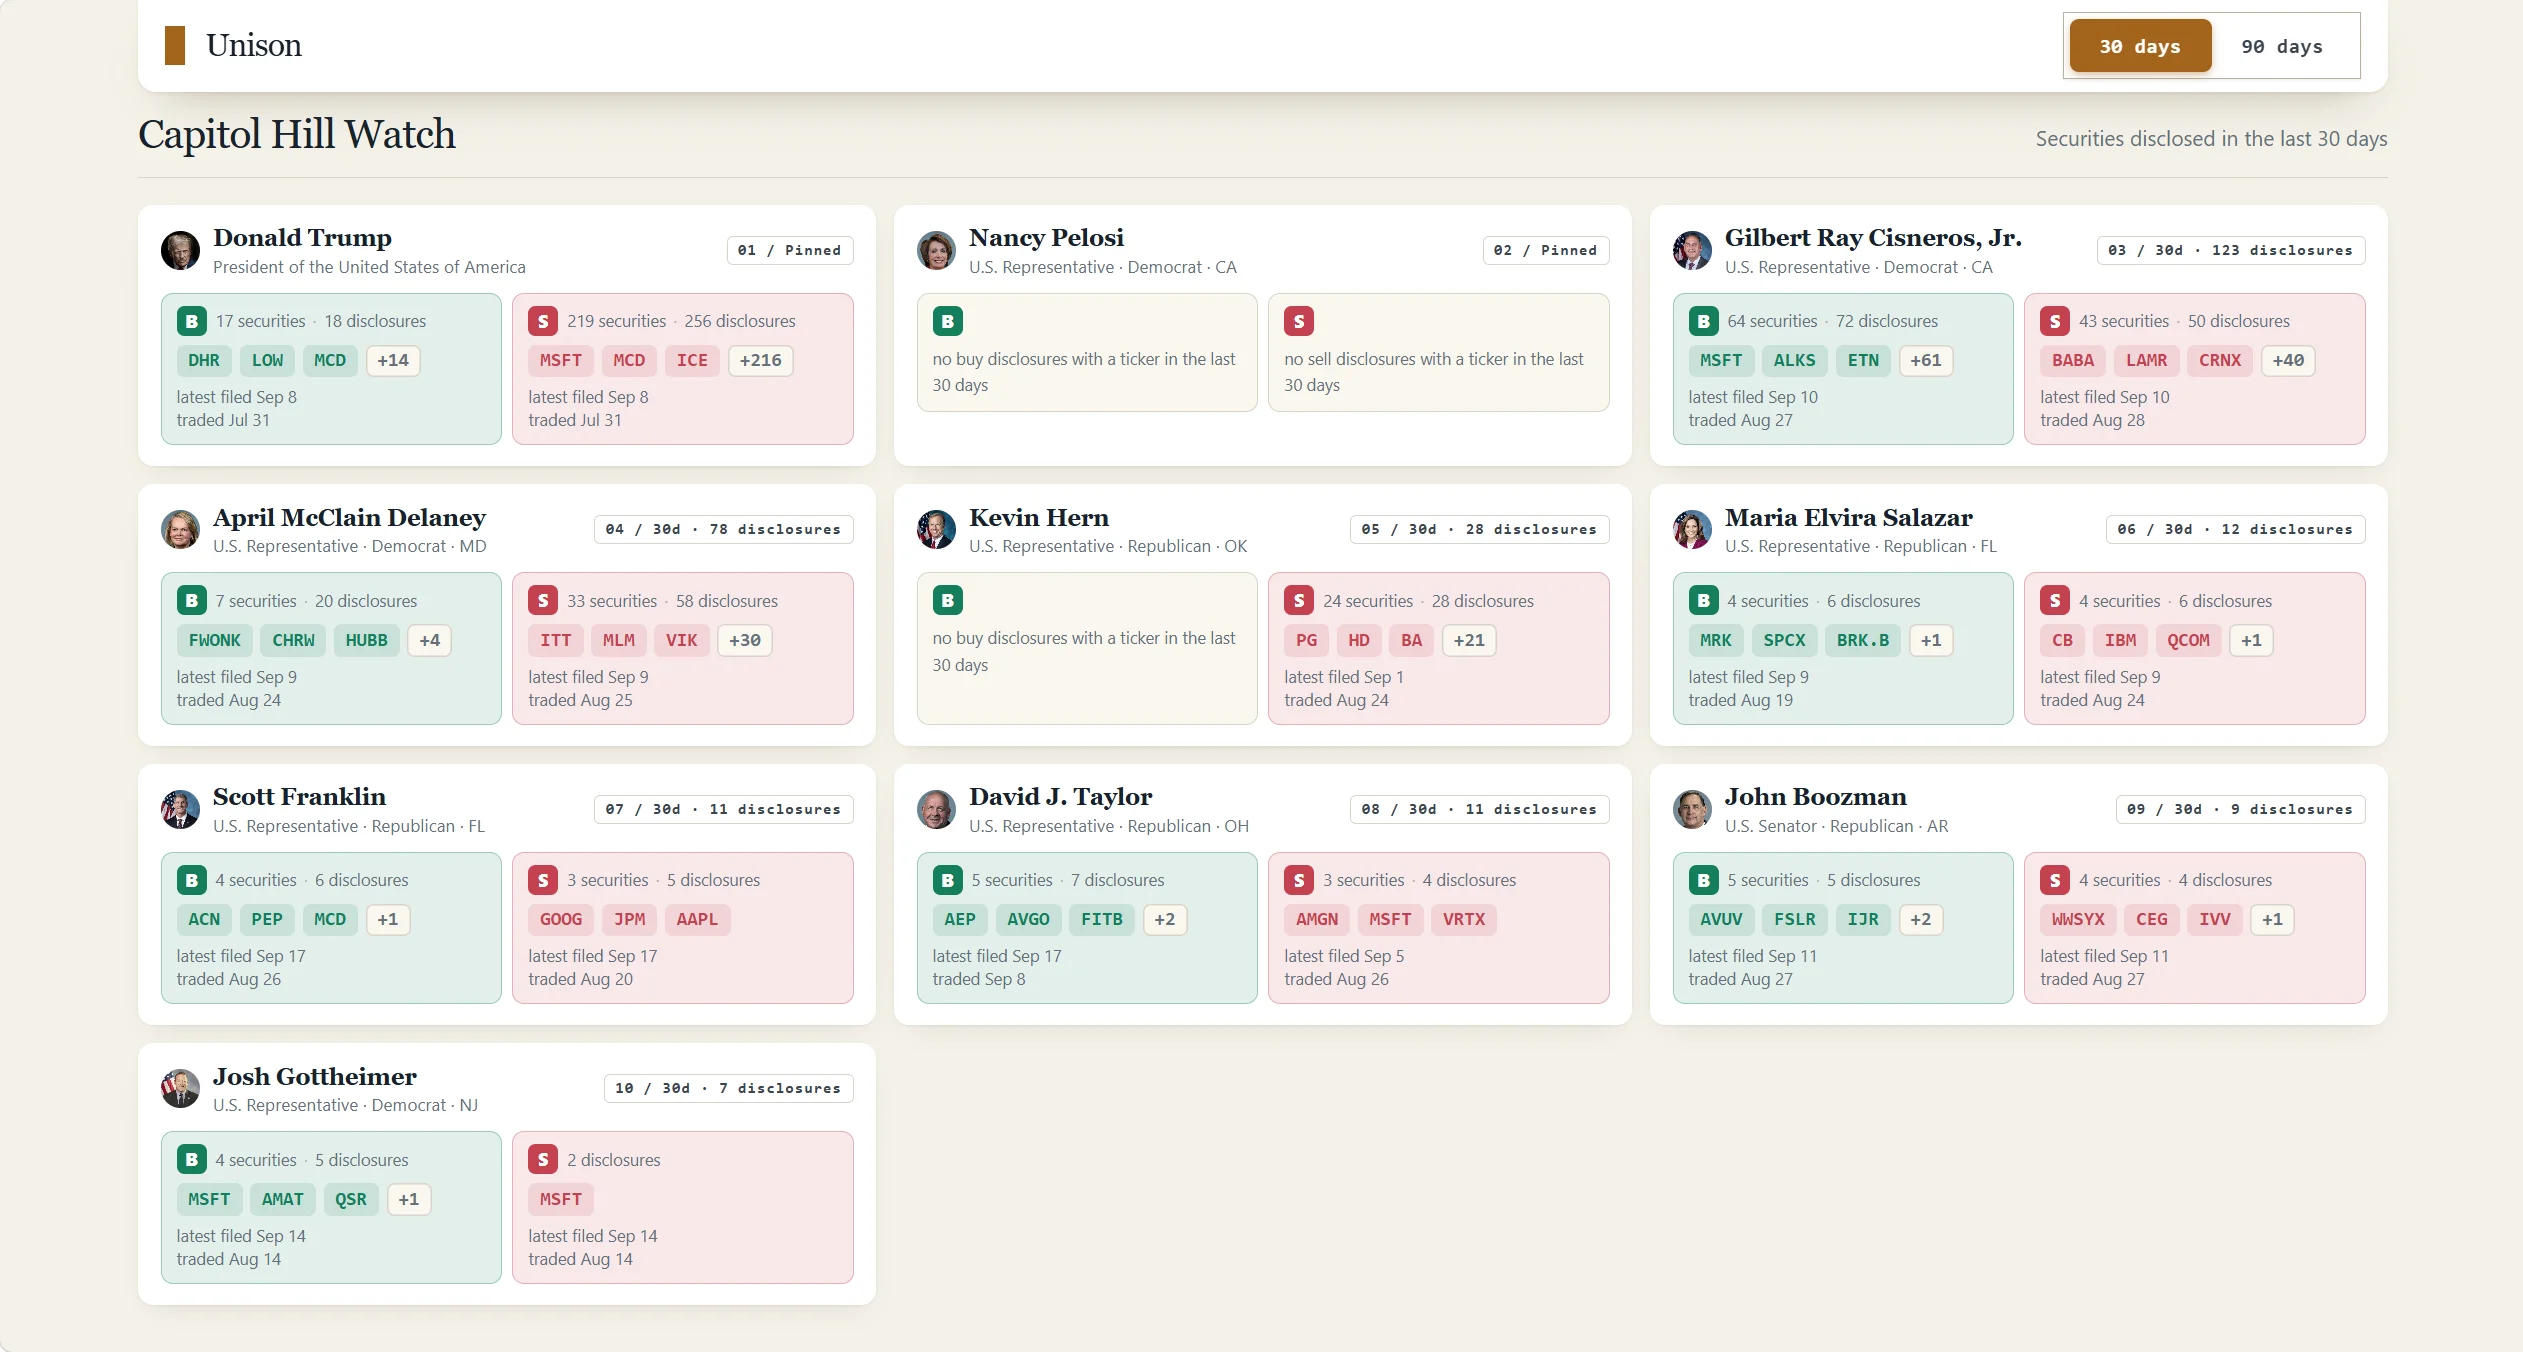
- Capitol Hill Watch — the 30-day priority view. Each person gets a purchase card and a sale card listing the tickers they disclosed, three visible with the rest folded into a +N chip; hovering any chip reveals the amount band filed for it.
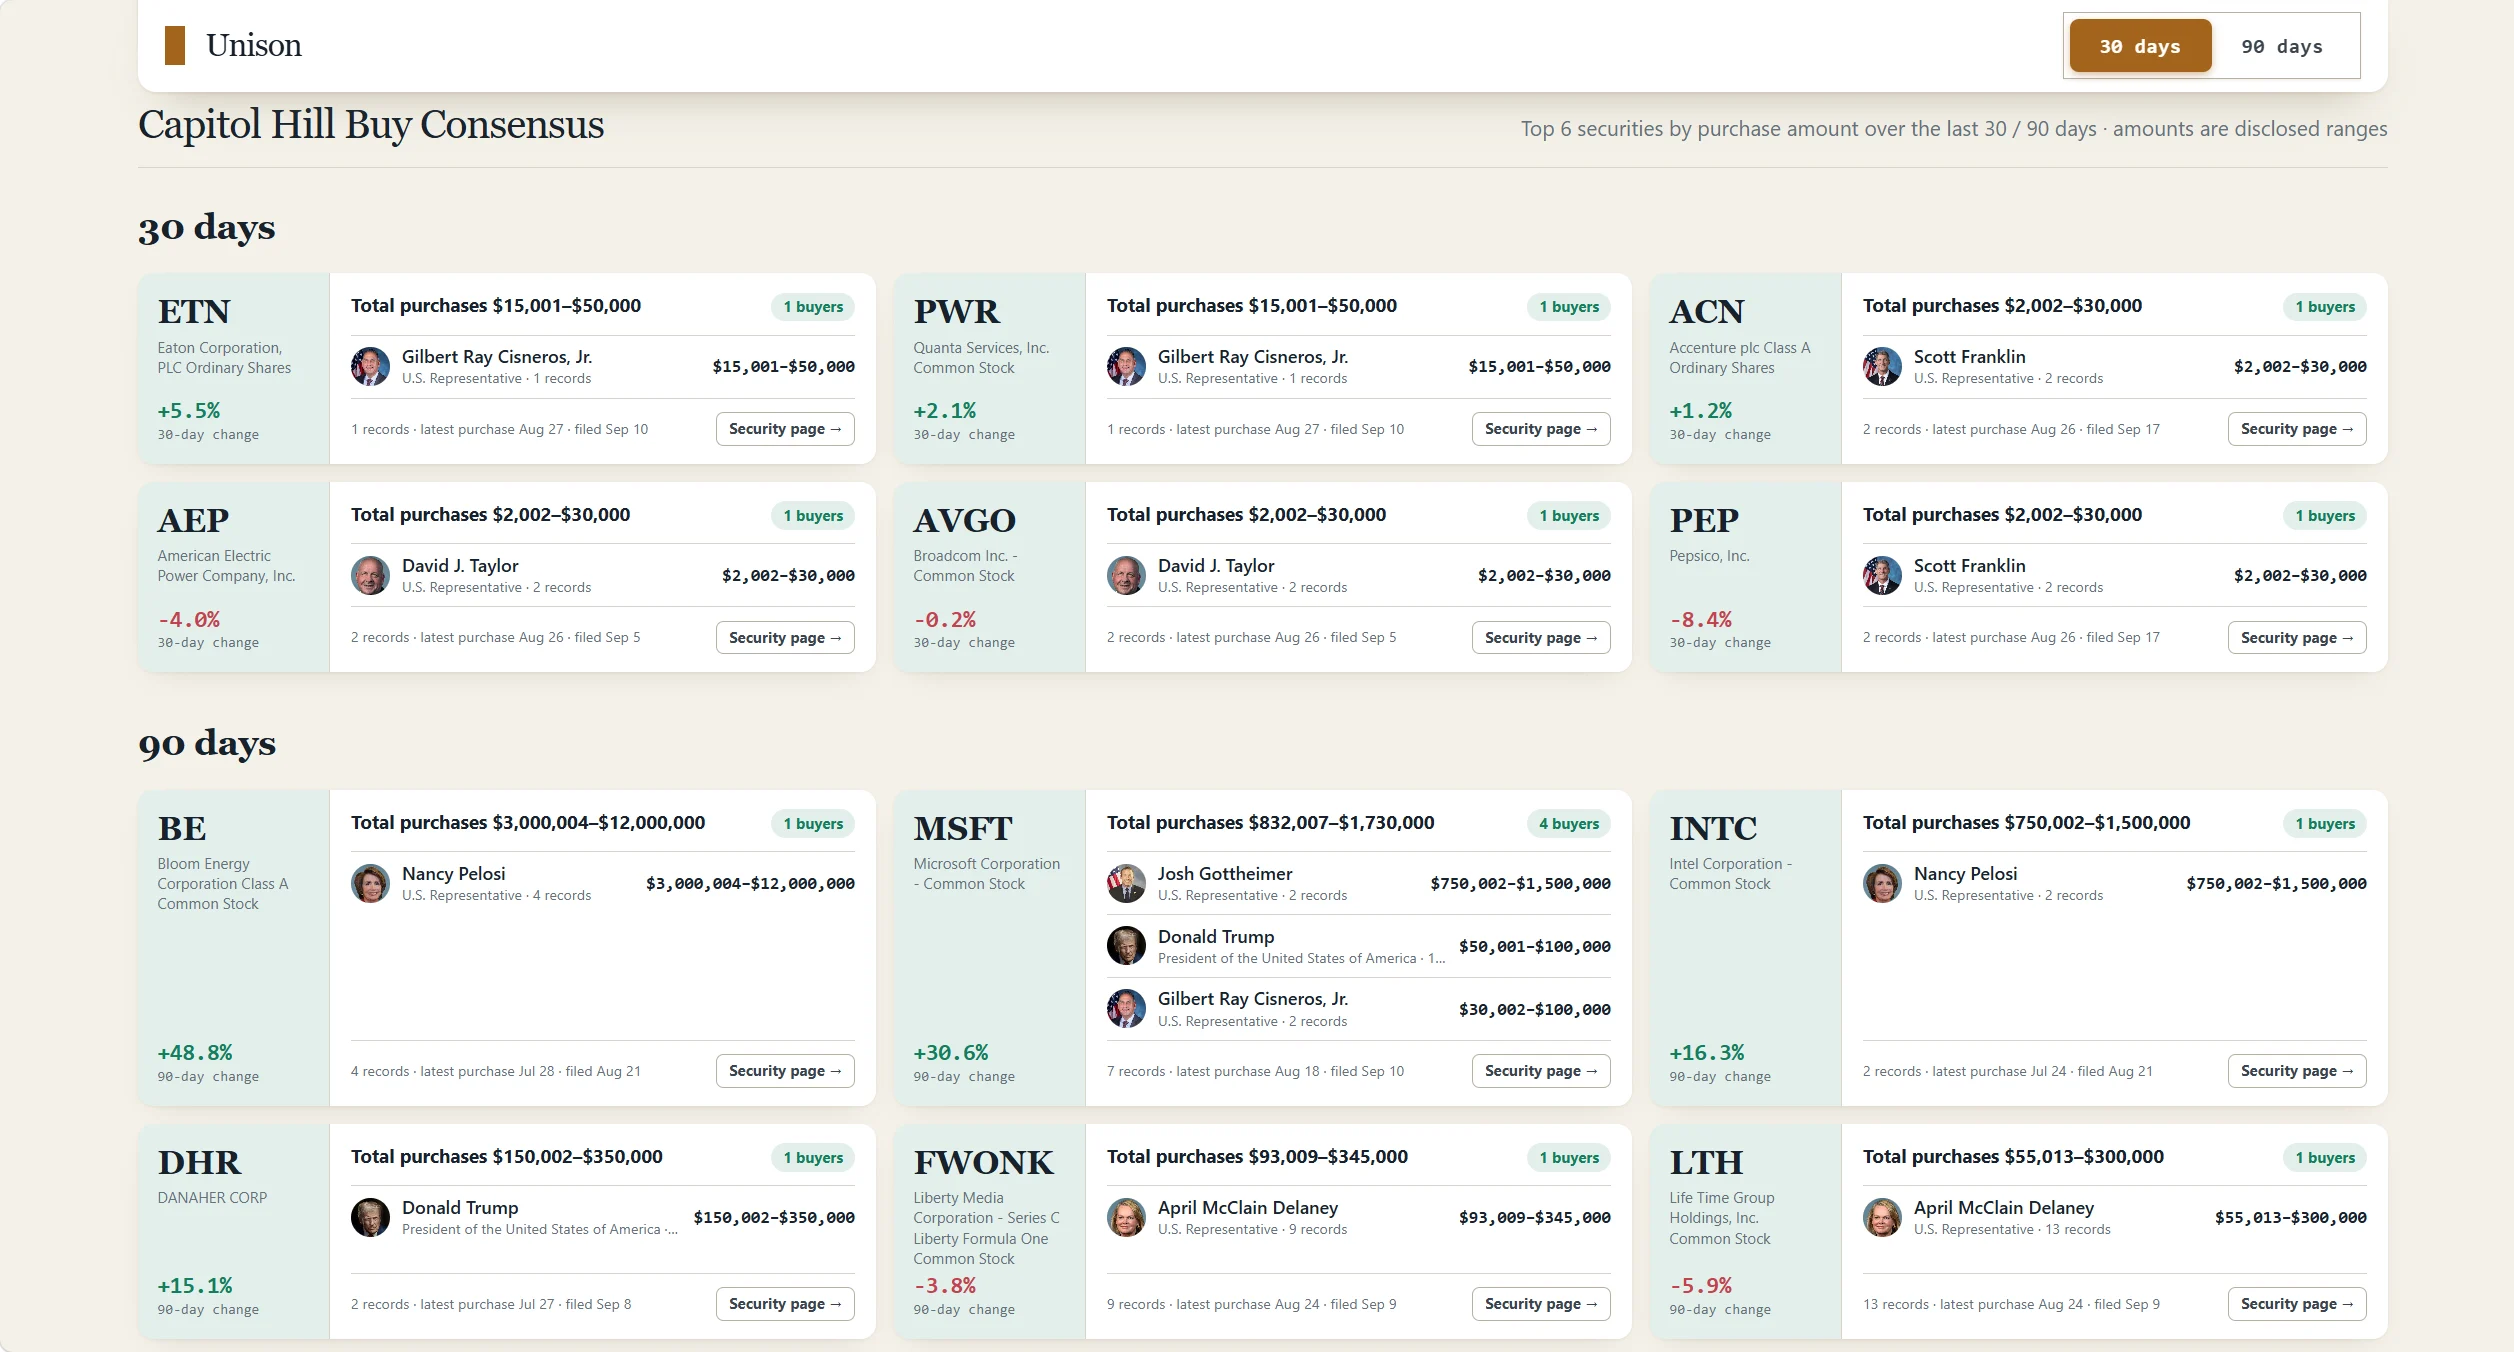
- Capitol Hill Buy Consensus — the 30-day and 90-day windows side by side. Tickers ranked by their total disclosed purchase amount, top six, each with the number of distinct buyers, the three largest of them, and the window's price change.
- Capitol Hill Hot Stocks — a sortable table (Security / Company, People involved, Buy / Sell, Price change). Overlapping portraits show how many officials disclosed the same security, and clicking one opens that person.
- Security Transaction Detail — the record-by-record table, filterable by direction (All / Buy / Sell), by instrument, and by search.
- Security view — 24 months of daily closing prices, with every disclosed trade marked on the curve by the portrait of the person who filed it: purchases above the line, sales below it.
- Person profile — one page per official: the Disclosed transactions table (Security, Owner, Direction, Amount, Trade date, Return since trade, Filed, Lag, Instrument), the split between direct ownership, spouse and joint, the split between stock and options, and a post-disclosure observation over that person's records.
The 30-day / 90-day control switches both windows at once, and the header states the data cutoff the snapshot was built from.
🔍 Person and Security Drill-Down
- Everything one official has disclosed, in a single filterable table
- Every official who disclosed a given ticker, and what each of them reported
- How a person's disclosed activity splits between purchases and sales
- How it splits across self, spouse, and joint ownership
- Whether the instrument was stock or an option
- How long each filing lagged the trade it reports
- How the security's price moved between the trade date and the market-data cutoff
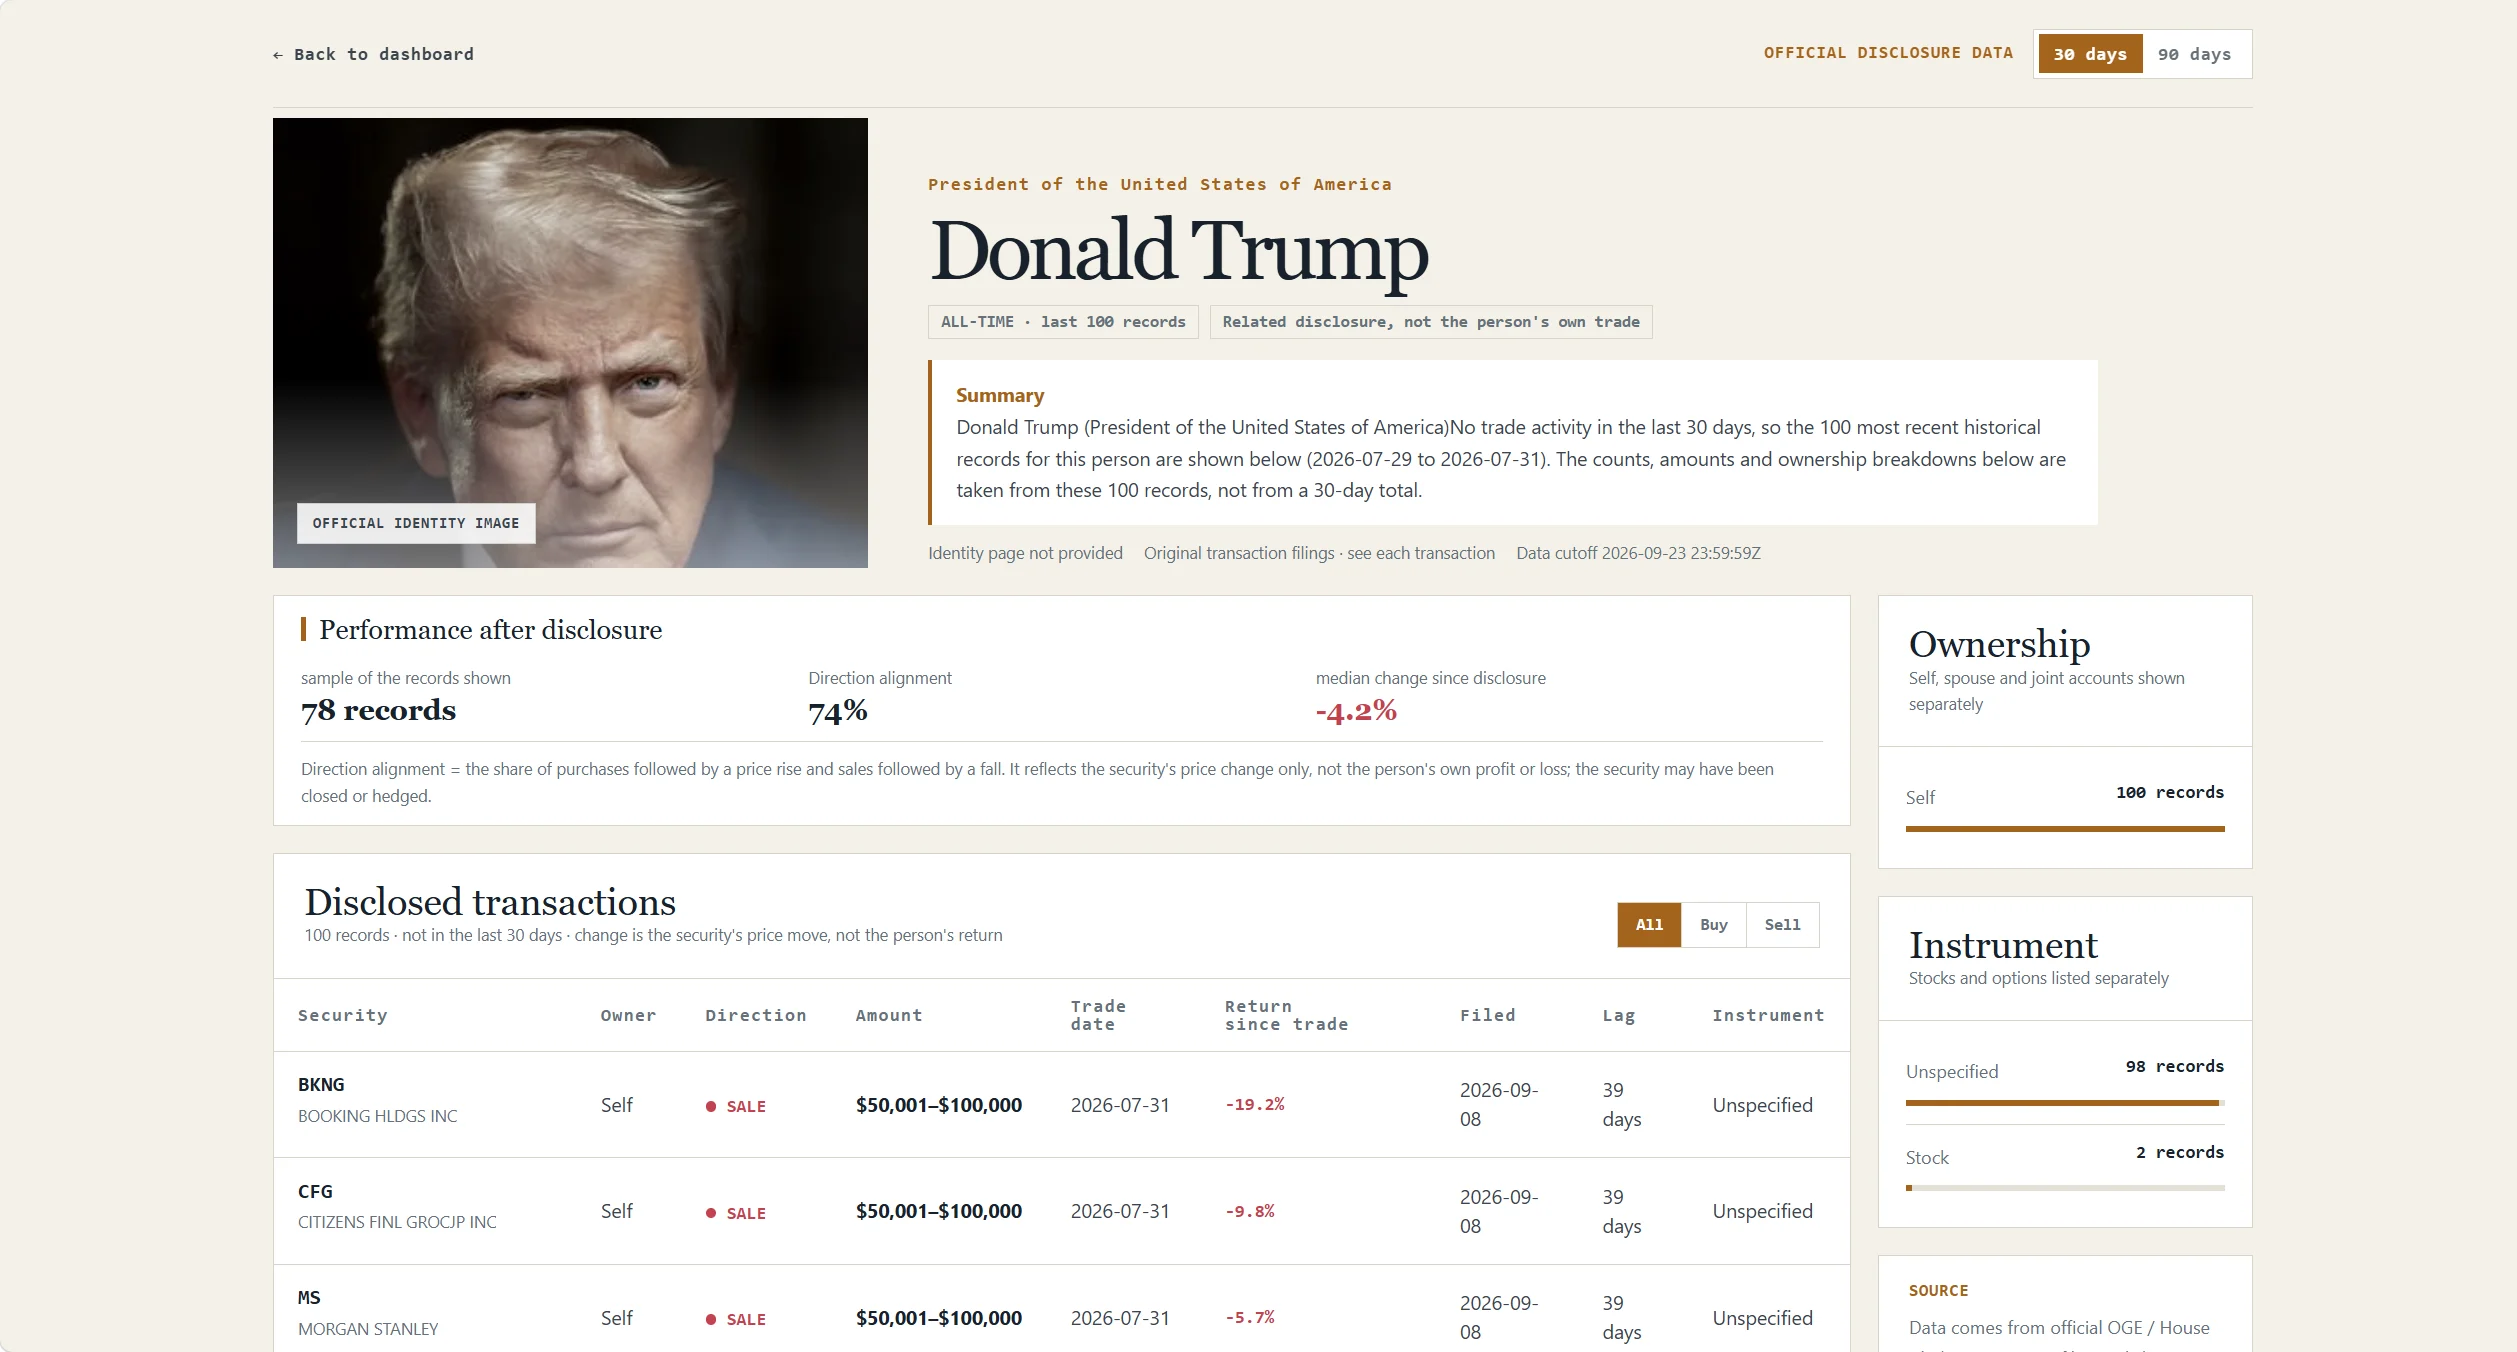
A price figure describes the security, not the filer: a row is a related disclosure, not proof that the person made or lost money on it.
The dashboard is a single self-contained HTML file with the portraits embedded in it, so you download it and open it locally rather than viewing it inside the chat.
🧠 Evidence-Linked Q&A
You can also ask questions directly. Answers are built from the same snapshot the dashboard renders, and every material claim is attributed to a filing or source record.
- Which securities did several officials buy in the last 30 days?
- Has anyone on the armed services committees disclosed a defense stock?
- What has this official disclosed over the past year?
- Which ticker drew the most officials in the 90-day window?
- Did this official buy or sell more last quarter?
- How many days after the trade was this filing submitted?
- Which officials have disclosed a position in this company?
Answers lead with the records behind a claim rather than a tally, and when a window holds too little evidence they say so instead of padding the answer. You can ask against three horizons: the 30-day window, the 90-day window, or the full record.
🔄 Data Updates
Unison reads the latest published snapshot each time you ask, so a dashboard always reflects the newest publication rather than a cached one. Every dashboard states its data cutoff, and any source that is running behind is flagged as delayed in the source panel.
⚠️ Important Disclaimer
Unison is an aggregation and research tool for public records. It is not an adviser, a broker, or a source of investment advice.
- Disclosures are filed after the fact and describe trades that already happened; they are not current positions
- Disclosed amounts are the bands as filed, not exact figures
- Reported holdings are as of their filing date, not as of today
- Price figures describe the security, not the filer's own return or profit
- Portrait images identify whose record a row is; they are not evidence of a trade, an amount, or a price
- Nothing here predicts returns — do your own research before making any decision


