
Type any ticker, or two to compare. In about a minute: who on X is bullish or bearish and why, like-weighted, with price context, follower counts and links to every post, plus an HTML dashboard. Promo and bait accounts filtered. 1 free report a day. Not investment advice.
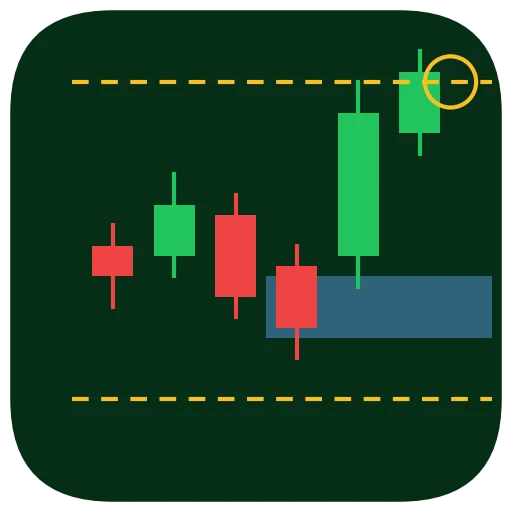
給一個商品與週期(或圖表截圖),自動標出 BOS/CHoCH、訂單塊 OB、FVG、流動性與溢價/折價區,並給出含進場區、停損、目標與確認條件的交易情境。 Name a symbol + timeframe (or upload a chart) — get BOS/CHoCH, order blocks, FVGs, liquidity and premium/discount marked, plus trade scenarios with entry, stop, target and confirmation.

Track top public market voices on X and turn scattered stock opinions, news, fund flows, and disclosed trades into a daily market consensus dashboard. See who is bullish, bearish, or has no clear stance on the same stock, then compare their reasoning, disagreements, and evolving views. Supports multilingual reports and cross-account stock analysis. Public information only—not investment advice.

每天收盤後掃描全美約 5,700 檔股票,自動找出傳奇交易員 Qullamaggie 的三大型態——Episodic Pivot(事件跳空)、Breakout(強勢突破)、Parabolic Short(拋物過熱)。互動雙語儀表板、個股 setup 歷史、財報催化驗證、市場多空燈號、部位試算與方法論教學。型態篩選與教育用途,非投資建議。

Markets do not move for one clean reason. Name any stock, index, sector, crypto asset, or macro market, and get a structured force-field report that shows the bearish and bullish drivers, their intensity, their time horizon, and the causal chain behind the move. The output is a self-contained HTML report with vector cards, net pressure by weekly/monthly/quarterly/annual horizon, key inflection points, and three scenarios. Open it in a browser or print it to PDF.
Track what insiders and 13 top funds, from Berkshire to Pershing Square, are buying and selling, straight from SEC filings. Fund-by-fund 13F changes, consensus buys, any-ticker lookup and insider red flags, every number linked to its source.

يُقدّم هذا البرنامج تحليلاً شاملاً ومتعدد الأوجه، بدءاً من الأسواق العالمية وصولاً إلى تحليلات خاصة بكل دولة وقطاع، فضلاً عن تحليلات الأسهم الفردية. ويُصنّف البيانات ضمن سيناريوهات متعددة، آخذاً في الاعتبار ليس فقط الأداء، بل أيضاً التوظيف والرواتب والاستثمارات المستقبلية. إنها مهارة تحليلية عملية تُفسّر سوق الأسهم استناداً إلى البيانات والهيكلية، بدلاً من الحدس.
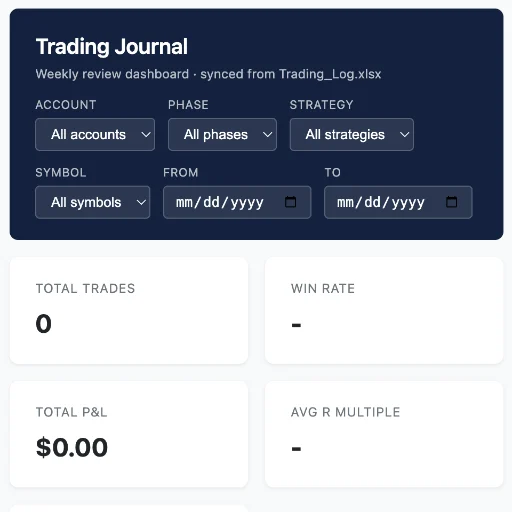
A single-file trading journal dashboard that turns every trade into data. See win rate, average R multiple and expectancy at a glance, so you know if a strategy really works. Filter by account, phase, strategy, symbol or date. Track cumulative P&L, profit by symbol, and weekly results. Live accounts get balance, profit above principal, and suggested weekly withdrawals at a percentage you set. Sortable trade log, no signup, no install. Your data stays with you. A tool for review, not advice.

Built on the buy-side research process used at 10+ hedge funds: - Screen: customizable filters across 10,000+ SEC-registered companies - Research: a full research report, plus AI-driven dialogue to help you form your own thesis - Value: a DCF model with an interactive HTML file - Size: half-Kelly position sizing to help you limit account drawdown - Recheck: pulls up your original thesis before you sell, no emotional trading