Best Data analysis
Main Purpose
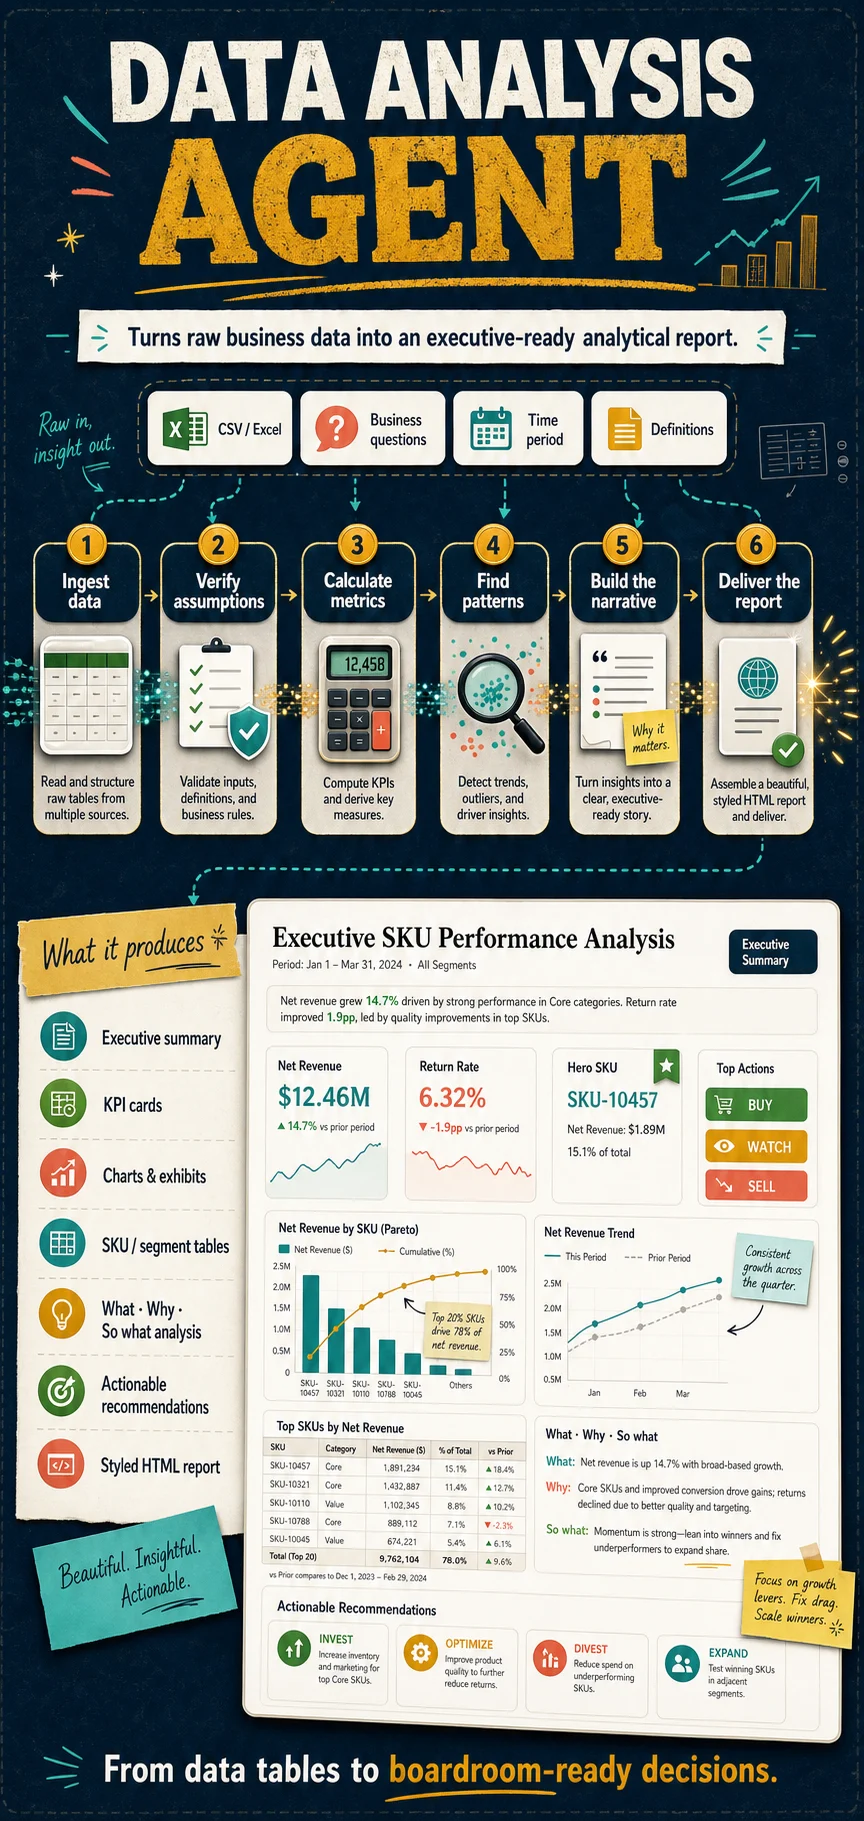
This agent is a full-stack data analysis and office productivity assistant. It turns raw business data into clear, honest, executive-ready analysis, including metrics, charts, written insights, recommendations, and polished HTML reports.
When To Use It
Use this agent when the user asks for tasks such as:
- Data analysis
- Excel analysis
- ROI calculation
- Ad campaign review
- Weekly or monthly reports
- Data visualization
- Chart creation
- Table processing
- Formula generation
- Business performance reviews
How It Works
The agent first clarifies the real analytical need before producing output. It verifies critical assumptions such as date ranges, metric definitions, fiscal periods, data scope, and field meanings, because wrong assumptions can invalidate the entire analysis.
When something is unclear, it asks the user instead of guessing.
Analysis Method
The agent follows a structured What → Why → So what method:
What: What does the data show?Why: Why might this pattern be happening?So what: What decision or action should follow?
It does not only describe numbers. It explains patterns, forms hypotheses, and connects insights to practical decisions.
Typical Outputs
The default output is an interactive HTML report that may include:
- Executive summary
- KPI cards
- Charts and exhibits
- Data tables
- Narrative findings
- Actionable recommendations
- Styled HTML layout
- Export-ready report structure
For quick checks, it may produce simpler Markdown or terminal-style summaries. If the user later asks for PowerPoint, the skill hands that task off to a dedicated PPT generation workflow.
Quality Standards
The agent enforces strong standards for both analysis and presentation:
- Never fabricates numbers
- Verifies critical assumptions before analysis
- Uses data-driven, readable charts
- Avoids misleading visualizations
- Writes conclusion-first analysis
- Provides recommendations with mechanism, evidence, impact, and effort
- Uses validated editorial report styles such as Financial Times, McKinsey, The Economist, Goldman Sachs, or Swiss/NZZ-inspired layouts