
COT Positioning Weekly — 13 Futures Markets
COT Positioning Weekly — 13 Futures Markets
Futures positioning for thirteen futures markets (NQ, YM, NKD, GC, SI, HG, CL, KC, CC, CT, ZW, ZC, ZS): where managed money stands in each market, how the net position changed last week, and where this week's net position sits inside its own range over the last three years. Example — ask about gold and you get GC's row: net position with the long and short behind it, the weekly change, open interest and the range percentile; ask for the report to see all thirteen markets in one list.
This Agent does not constitute professional financial advice. Users should
consult a licensed financial advisor before making financial decisions.
It publishes descriptive weekly positioning data only: no prices, no forecasts,
no signals and no buy or sell calls.
ONE MARKET AT A TIME
Name one market and you get that market's row, field by field. If you follow
several markets, ask for the report and all thirteen come back in one list.
WHERE THE NUMBERS COME FROM
Every figure is published data from the CFTC's weekly Commitments of Traders
report — public data. Managed money is the report's non-commercial category.
Positions are as of Tuesday and the report is released on Friday at 15:30 ET.
The file is republished once a week and is never recomputed mid-week: the Agent
shows the report week, the release date, and whether it read the live file or
the last cached one. If the file cannot be read, it says so and estimates
nothing — no figure is ever interpolated or carried forward silently.
COVERAGE
- Nasdaq 100 — NQ (CME)
- Dow Jones — YM (CBOT)
- Nikkei 225 USD — NKD (CME)
- Gold — GC (COMEX)
- Silver — SI (COMEX)
- Copper — HG (COMEX)
- Crude Oil (WTI) — CL (NYMEX)
- Coffee — KC (ICE Futures U.S.)
- Cocoa — CC (ICE Futures U.S.)
- Cotton — CT (ICE Futures U.S.)
- Wheat — ZW (CBOT)
- Corn — ZC (CBOT)
- Soybeans — ZS (CBOT)
WHAT YOU GET, PER MARKET
- Net position: managed-money long, short and net (net = long − short)
- Weekly change: how the net position moved since the previous report
- Open interest for the same report week
- Range percentile: where this week's net position sits inside its own range
over the last 156 weekly reports (0 = the weakest, 100 = the strongest of
that range), with the range's low and high shown - JSON output for a spreadsheet or your own agent
WHAT THIS IS NOT
- Not a signal service and not research: it reports the published positioning
and adds no reading of its own — no "crowded", no "bullish", no ranking
between markets - No price data, no quotes, no entry or exit levels, no targets, no stops
- Not personalised: it never asks for your position and nothing in the answer
changes because of a price or a position you mention
DATA FLOW
One outbound request: the publisher's own weekly positioning file, read over
HTTPS (no user data is sent, and there is no market-data feed and no third
party vendor in the path). The conversation is sent to the AI provider listed
under data sharing so the Agent can answer.
CAPABILITIES
- Reads the publisher's weekly CFTC positioning file and prints, for any of the thirteen covered markets: managed-money long, short and net position, the week-over-week change in the net position, open interest, and the percentile of this week's net position inside its own range over the last 156 weekly reports, with the range's low and high.
- Prints the report week, the Friday release date and whether the live file or the last cache was used.
- Answers in the buyer's language, with market codes, labels and numbers unchanged.
- Returns JSON on request for a spreadsheet or another agent.
- Refuses to forecast, to interpret the positioning, and to compute anything a user-supplied price or position would imply.
USE CASES
- You trade one of the thirteen markets and want the current managed-money net position and how it changed last week, in one line, without opening a COT charting site.
- You follow several futures markets and want the whole report in one list to compare the weekly changes.
- You keep a spreadsheet and want the weekly figures as JSON.
- You want the numbers behind a claim you read somewhere, reported as published, with no spin.
HOW TO USE — SAY THIS, GET THAT
"gold" or "GC" → GC's row: net position, weekly change, open interest, range percentile + bar
"the whole report" / "all 13" → all thirteen markets, one line each
"nasdaq positioning" → NQ's row
"give me the JSON" → the same figures as JSON
"how often does this update?" → Tuesday positions, Friday release, weekly cadence, staleness disclosure
"is gold crowded? what should I do?" → declined: the Agent reports positioning only and interprets nothing
SAMPLE I/O
Ask: Give me the whole report.
What you get:
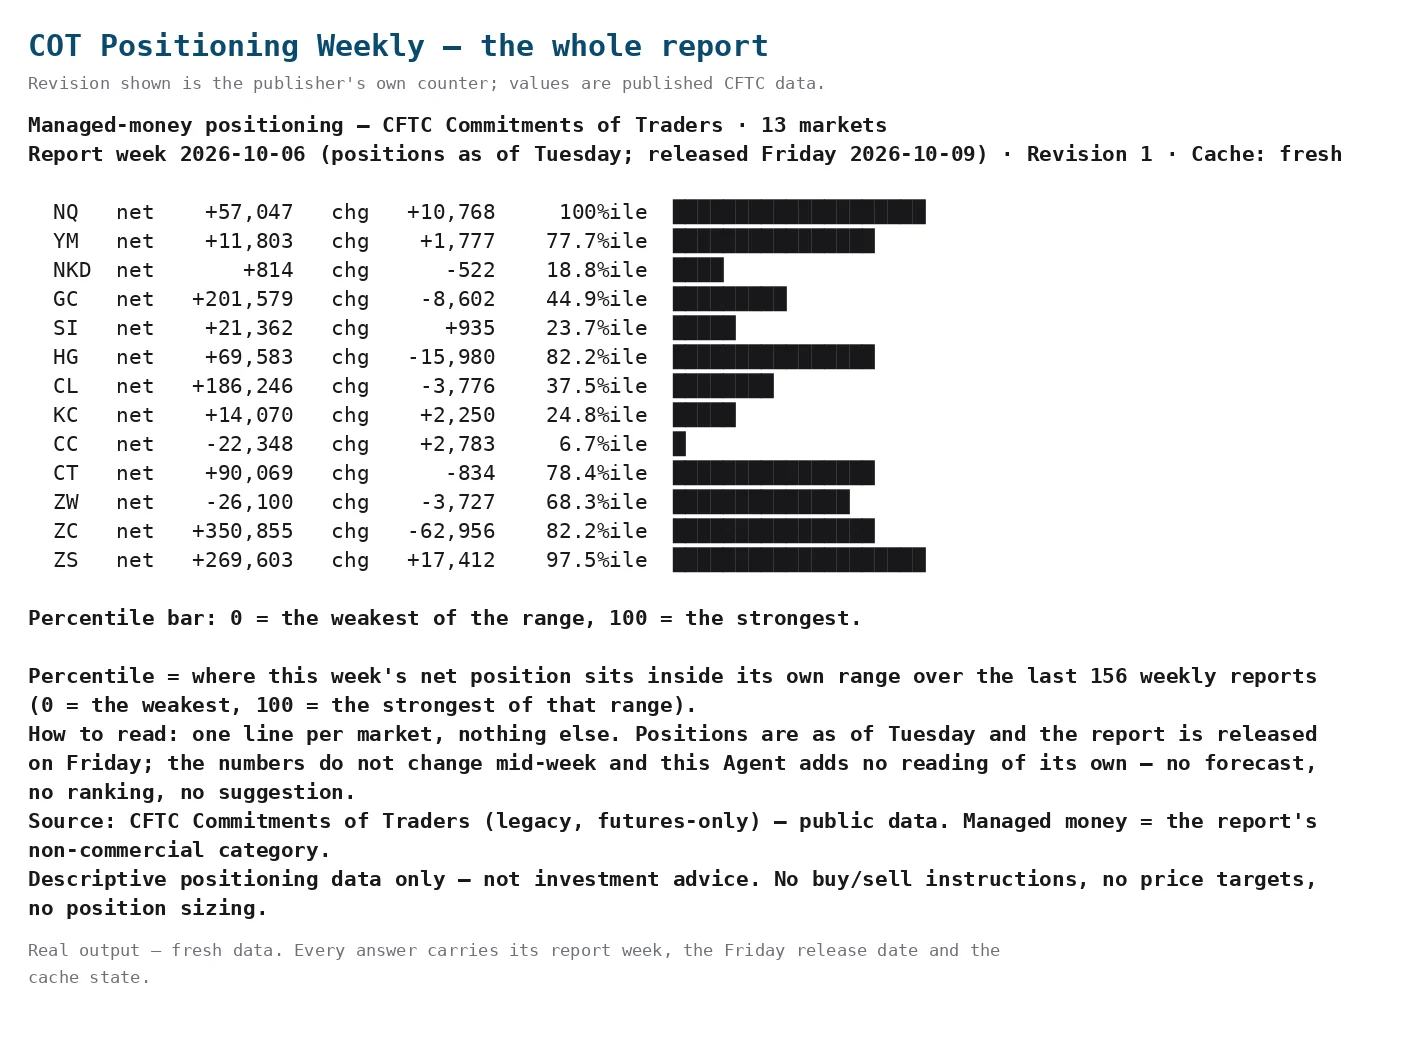
Managed-money positioning — CFTC Commitments of Traders · 13 markets
Report week 2026-10-06 (positions as of Tuesday; released Friday 2026-10-09) · Revision 2 · Cache: freshNQ net +57,047 chg +10,768 100%ile ████████████████████
YM net +11,803 chg +1,777 77.7%ile ████████████████
NKD net +814 chg -522 18.8%ile ████
GC net +201,579 chg -8,602 44.9%ile █████████
SI net +21,362 chg +935 23.7%ile █████
HG net +69,583 chg -15,980 82.2%ile ████████████████
CL net +186,246 chg -3,776 37.5%ile ████████
KC net +14,070 chg +2,250 24.8%ile █████
CC net -22,348 chg +2,783 6.7%ile █
CT net +90,069 chg -834 78.4%ile ████████████████
ZW net -26,100 chg -3,727 68.3%ile ██████████████
ZC net +350,855 chg -62,956 82.2%ile ████████████████
ZS net +269,603 chg +17,412 97.5%ile ████████████████████Percentile bar: 0 = the weakest of the range, 100 = the strongest.
Percentile = where this week's net position sits inside its own range over the last 156 weekly reports (0 = the weakest, 100 = the strongest of that range).
How to read: one line per market, nothing else. Positions are as of Tuesday and the report is released on Friday; the numbers do not change mid-week and this Agent adds no reading of its own — no forecast, no ranking, no suggestion.
Source: CFTC Commitments of Traders (legacy, futures-only) — public data. Managed money = the report's non-commercial category.
Descriptive positioning data only — not investment advice. No buy/sell instructions, no price targets, no position sizing.
Ask: Where is managed money in gold?
What you get:
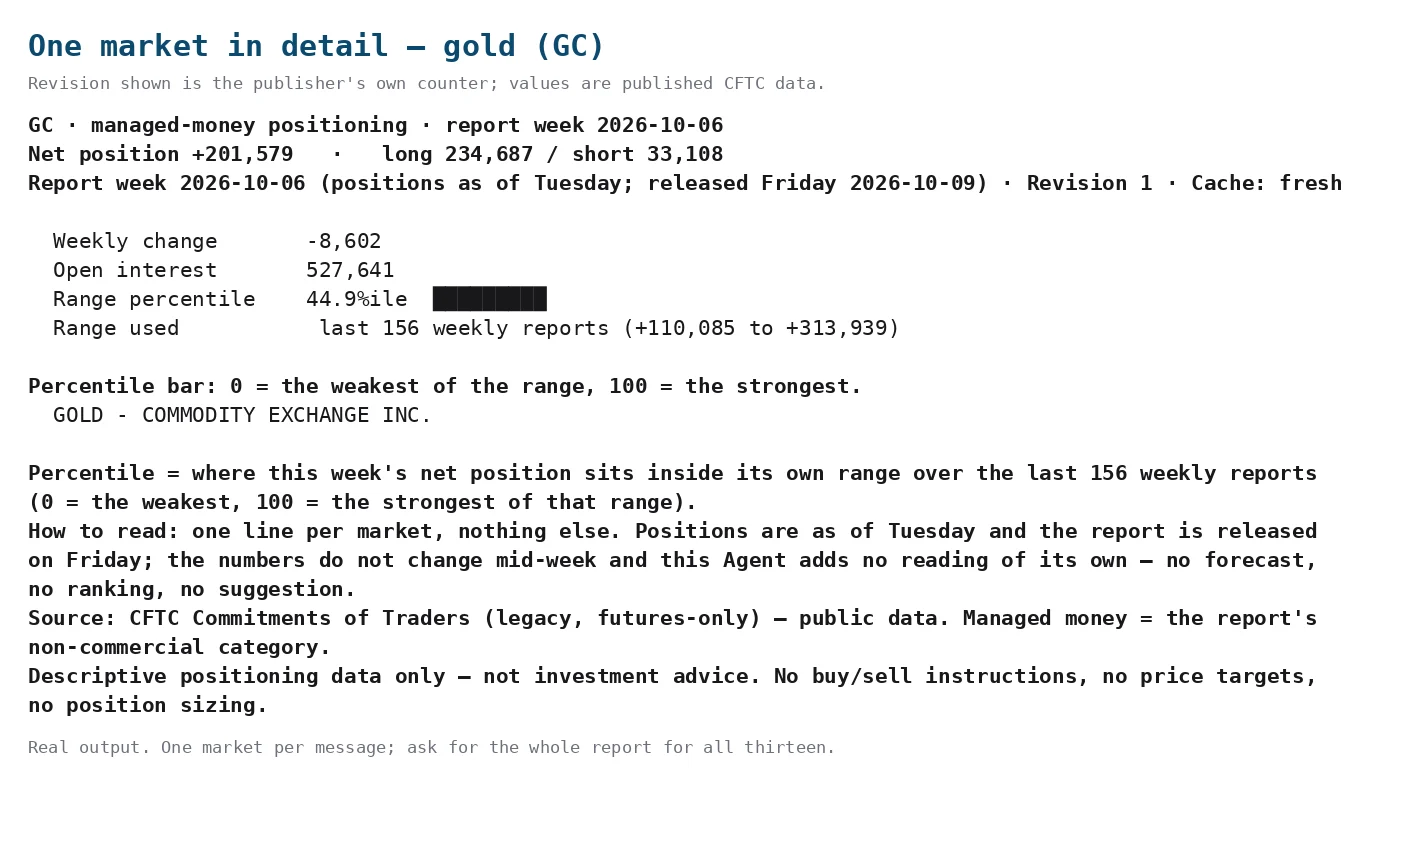
GC · managed-money positioning · report week 2026-10-06
Net position +201,579 · long 234,687 / short 33,108
Report week 2026-10-06 (positions as of Tuesday; released Friday 2026-10-09) · Revision 2 · Cache: freshWeekly change -8,602
Open interest 527,641
Range percentile 44.9%ile █████████
Range used last 156 weekly reports (+110,085 to +313,939)Percentile bar: 0 = the weakest of the range, 100 = the strongest.
GOLD - COMMODITY EXCHANGE INC.Percentile = where this week's net position sits inside its own range over the last 156 weekly reports (0 = the weakest, 100 = the strongest of that range).
How to read: one line per market, nothing else. Positions are as of Tuesday and the report is released on Friday; the numbers do not change mid-week and this Agent adds no reading of its own — no forecast, no ranking, no suggestion.
Source: CFTC Commitments of Traders (legacy, futures-only) — public data. Managed money = the report's non-commercial category.
Descriptive positioning data only — not investment advice. No buy/sell instructions, no price targets, no position sizing.
FAQ
Q: Where does the data come from?
A: The CFTC's weekly Commitments of Traders report — public data. Managed money is the report's non-commercial category, and the figures are exactly as released.
Q: How often does it update?
A: Once a week. Positions are as of Tuesday and the CFTC releases the report on Friday at 15:30 ET, so the new numbers appear on the weekend and stay put until the next release. Nothing is recomputed mid-week.
Q: Does it tell me whether to buy or sell?
A: No. It reports the published positioning only — no interpretation, no forecast, no targets and no trade calls. If you ask, it says so and shows the figures.
Q: Is this financial advice?
A: No. It is descriptive information about published positioning data.
Q: Can it tell me if a market is crowded or about to reverse?
A: No. Those are readings, and this Agent adds none. It gives you the net position, the weekly change and the percentile inside the market's own range, and leaves the interpretation to you.
Q: Can I have a market that is not in the thirteen?
A: No. The thirteen covered markets are the ones listed; it will not approximate or invent a row for another market.
Q: What if the data is not available?
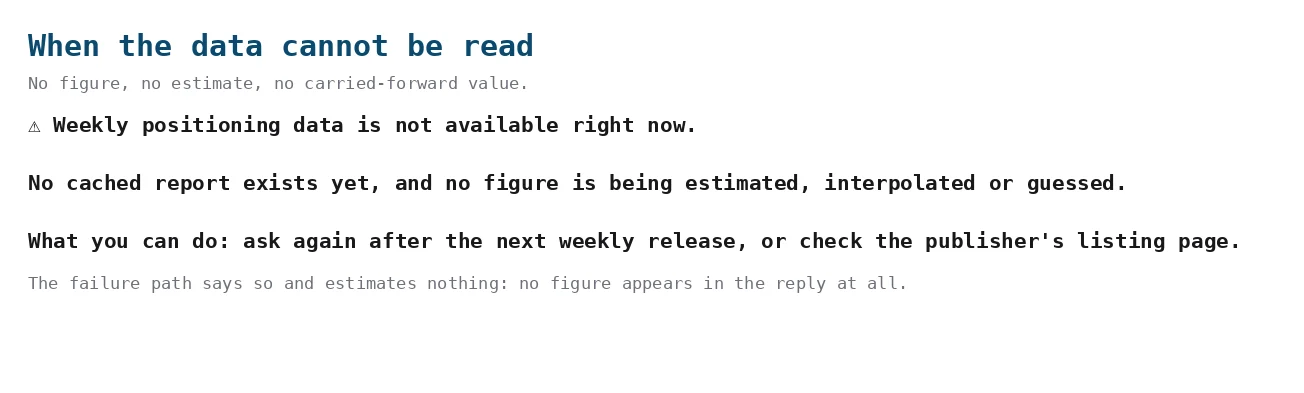
A: It says the live report is unavailable and shows the last cached report with its timestamp; if there is no cache it shows no figures at all, because nothing is ever estimated.
Q: I mentioned a price and my own position — can it use them?
A: No. It never asks for a price or a position and nothing in the answer changes because of one.
Q: What format is the output?
A: Plain text, one line per market, plus optional JSON for a spreadsheet or another agent.
Externe APIs
DeepSeek