

Trade Journal Analyzer — Pro Performance Review
Trade Journal Analyzer
Paste your broker statement. Get an institutional-grade performance review — win rate, profit factor, expectancy, drawdown, and the one fix that matters most — delivered as a polished, interactive HTML report you can open in any browser, print, or export to PDF.
Built by a CFA and FRM charterholder. For informational and educational purposes only.
Watch it work

The real report — full view
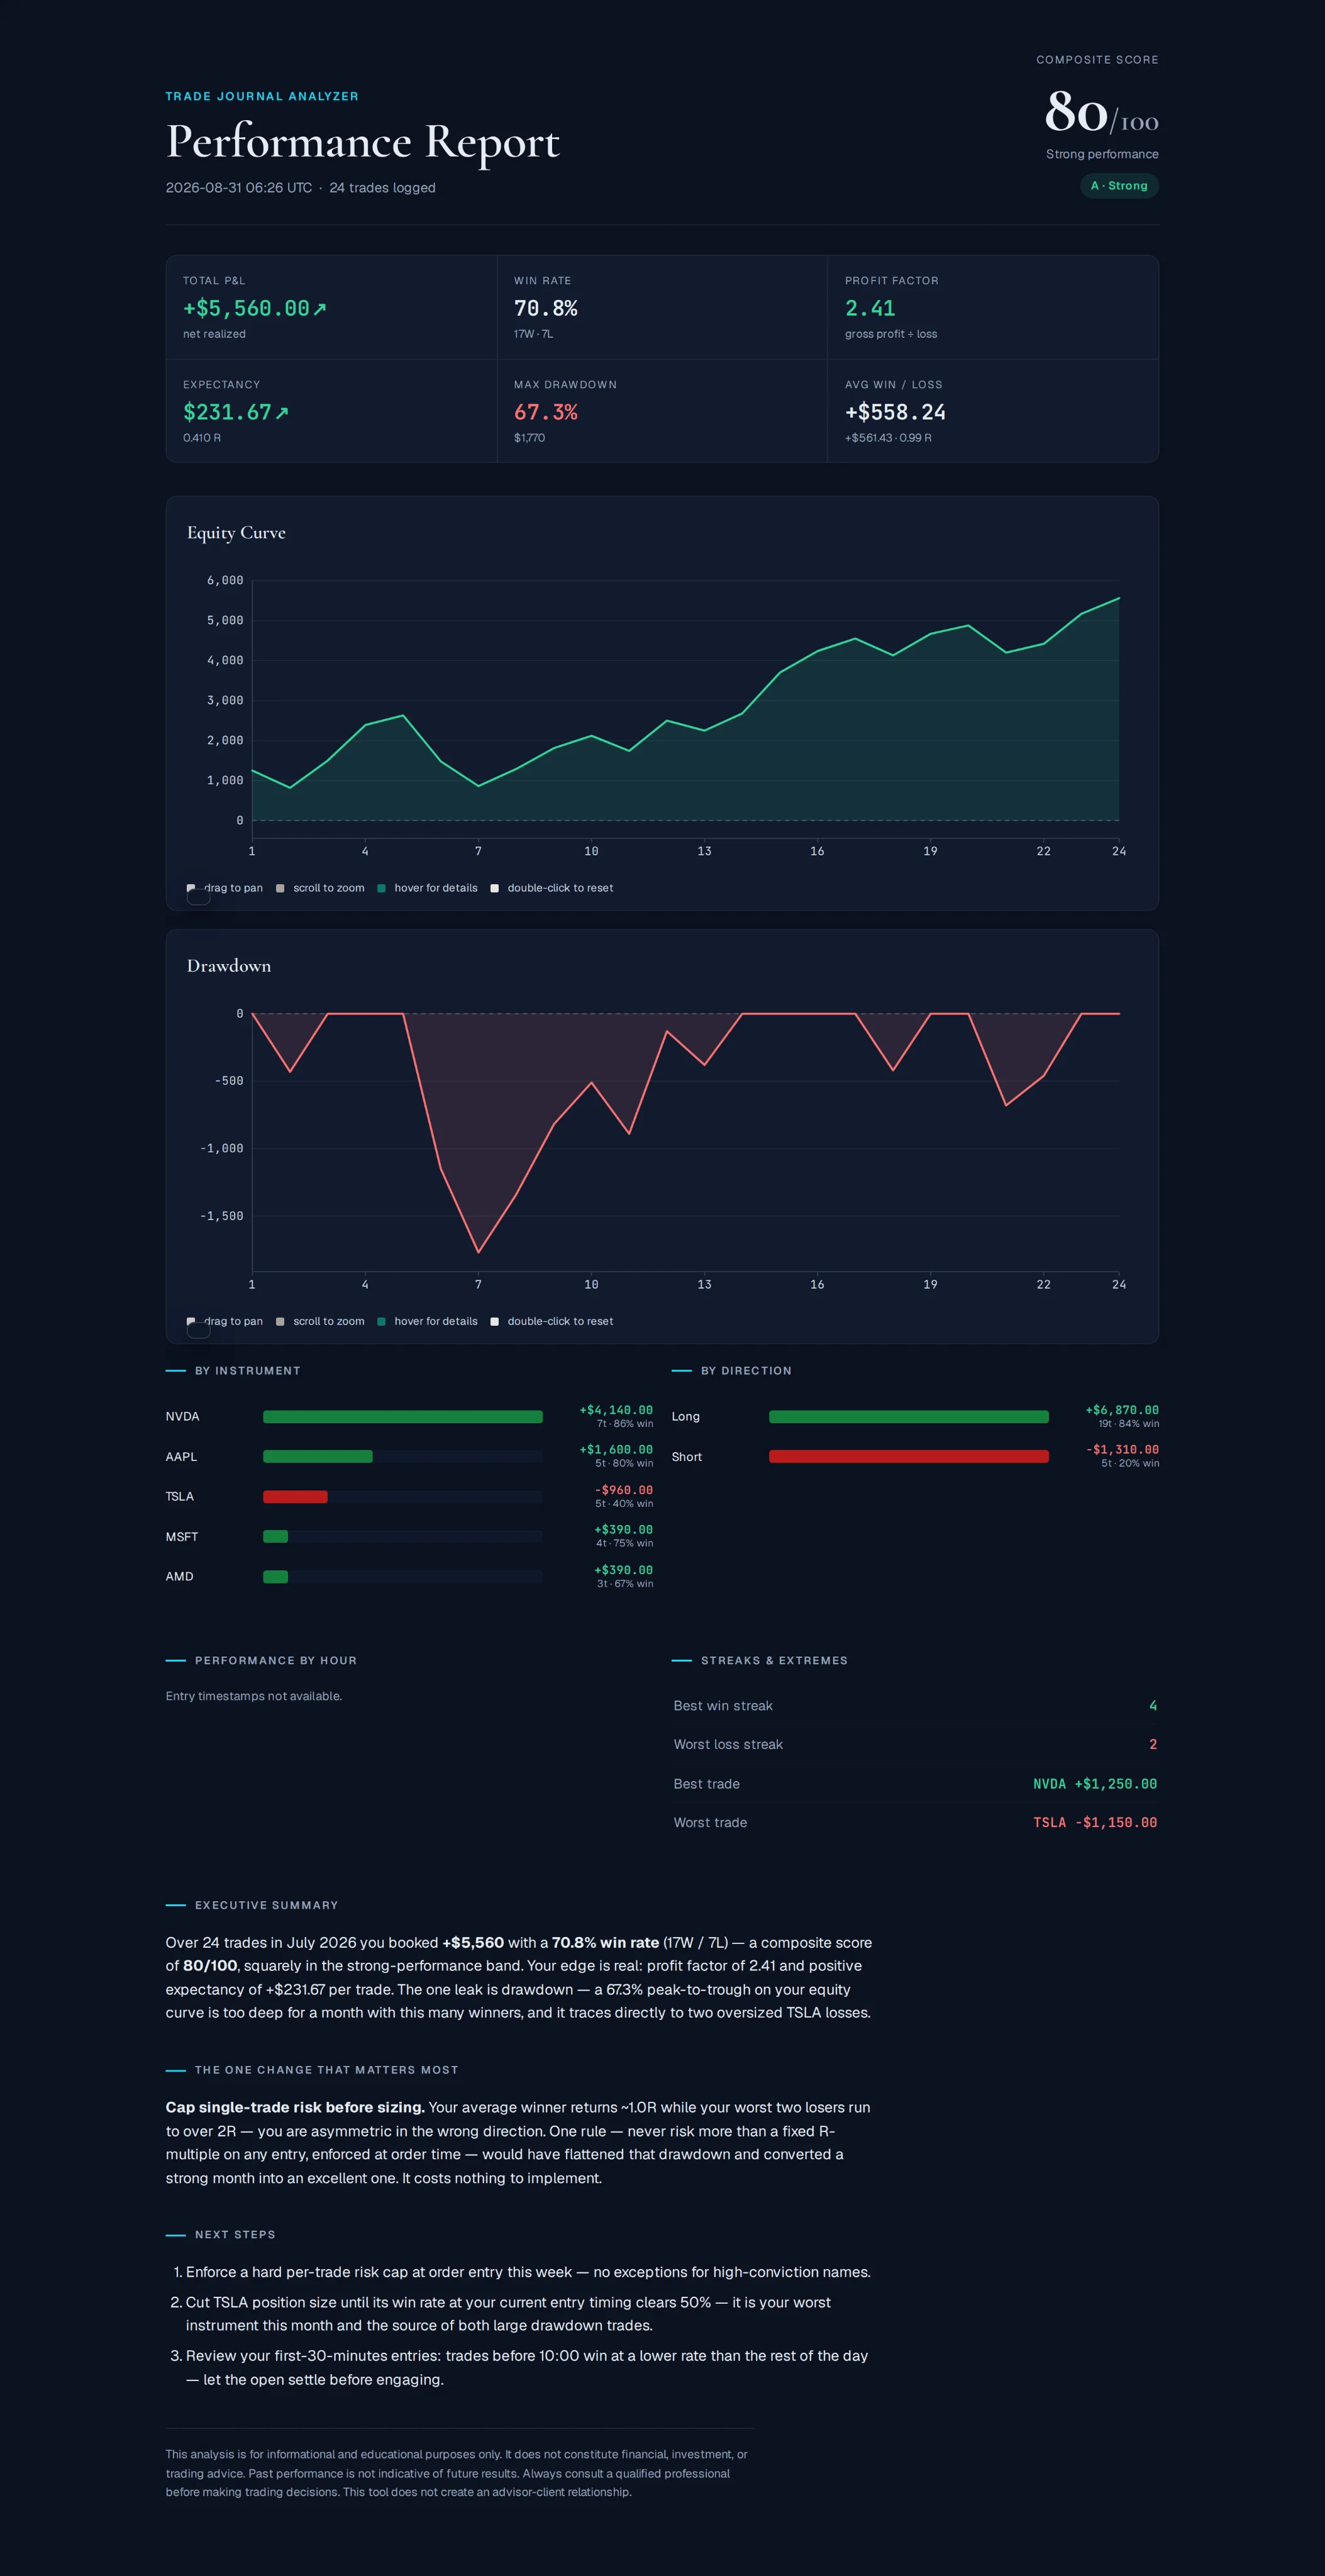
What you actually see
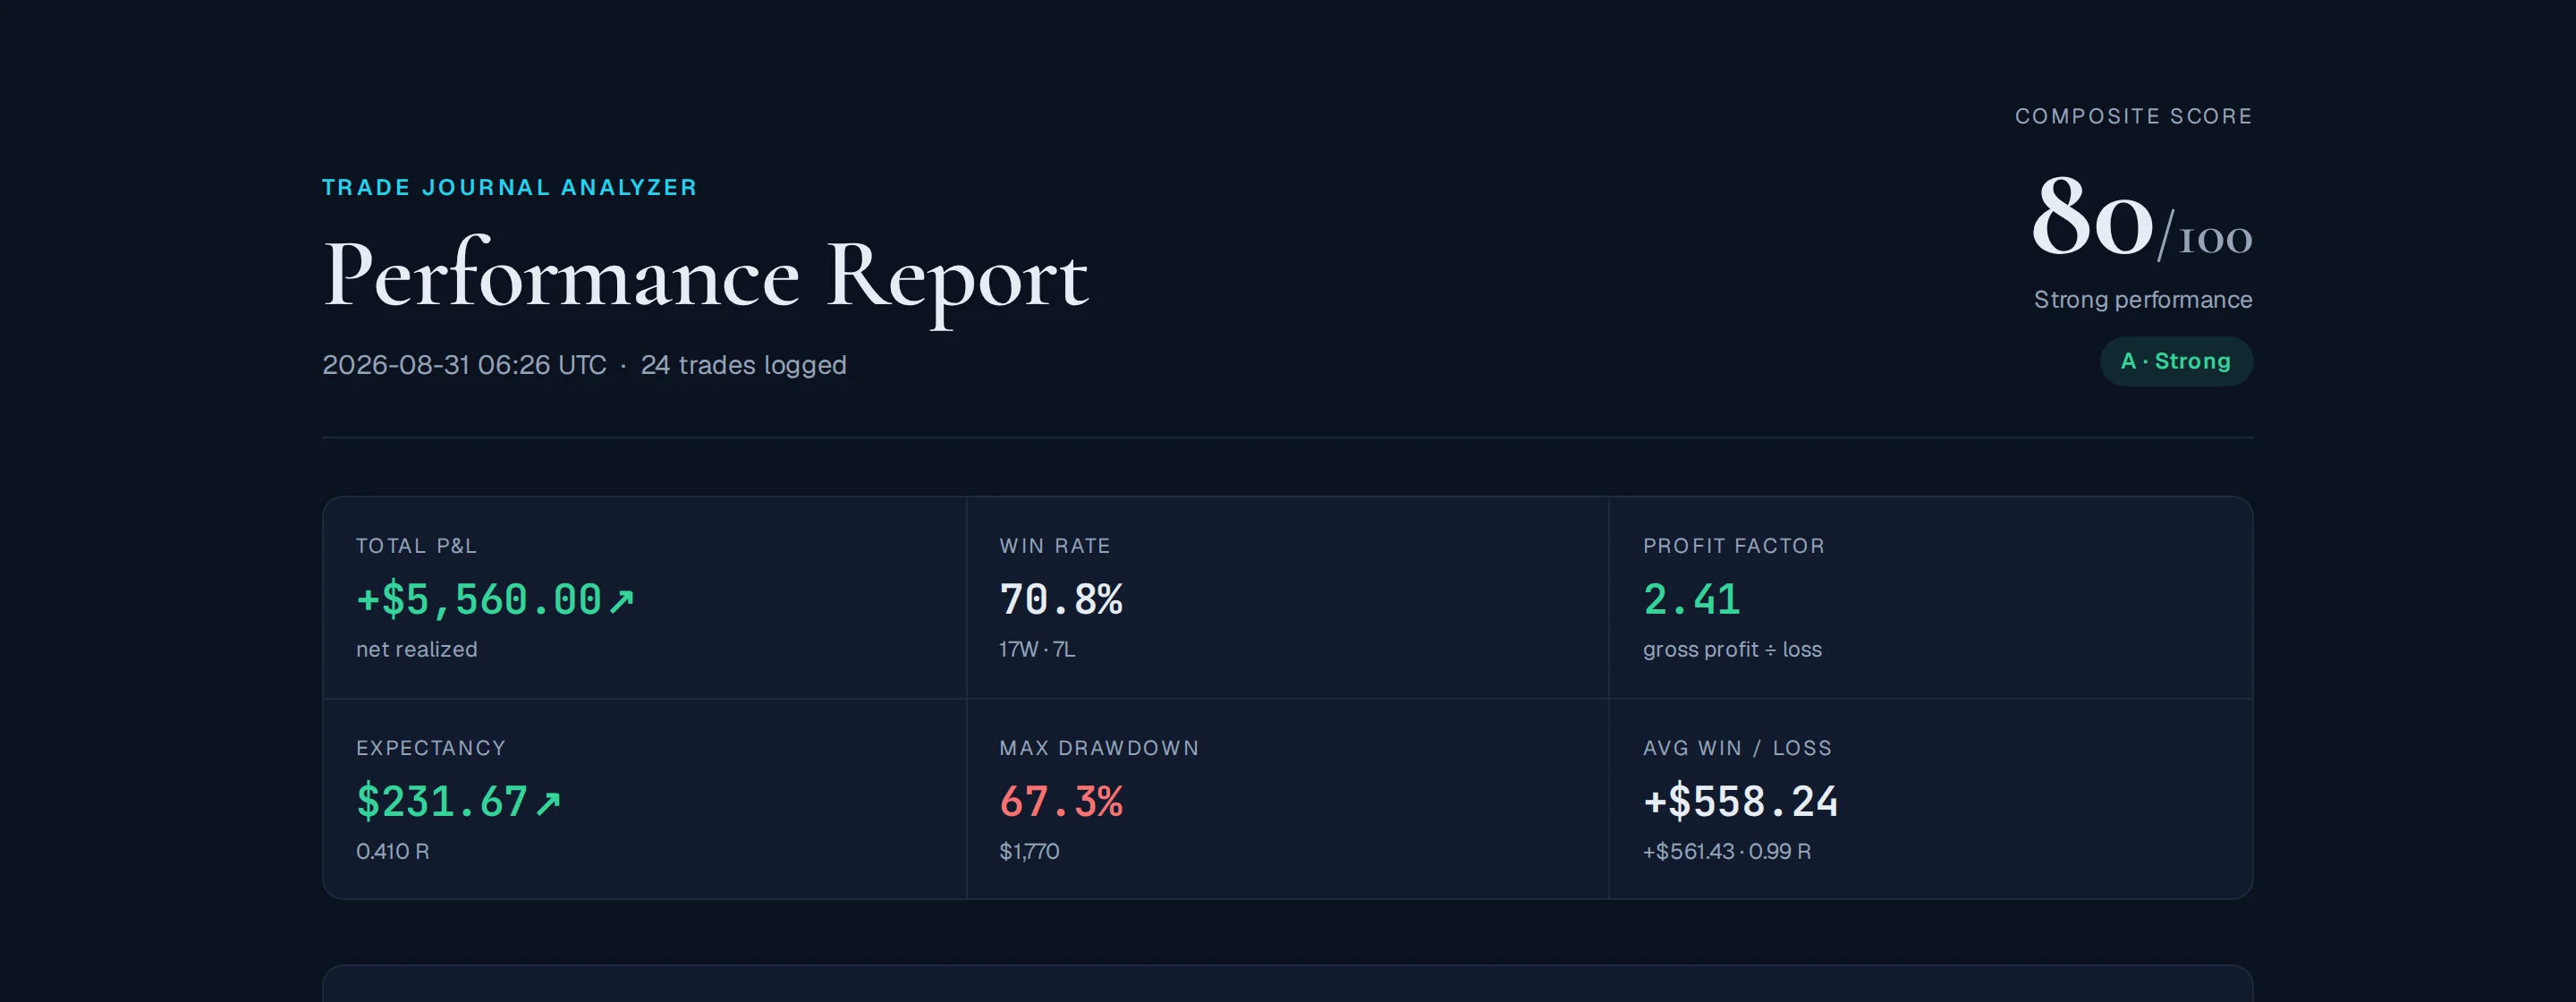
KPI cards — the numbers that matter
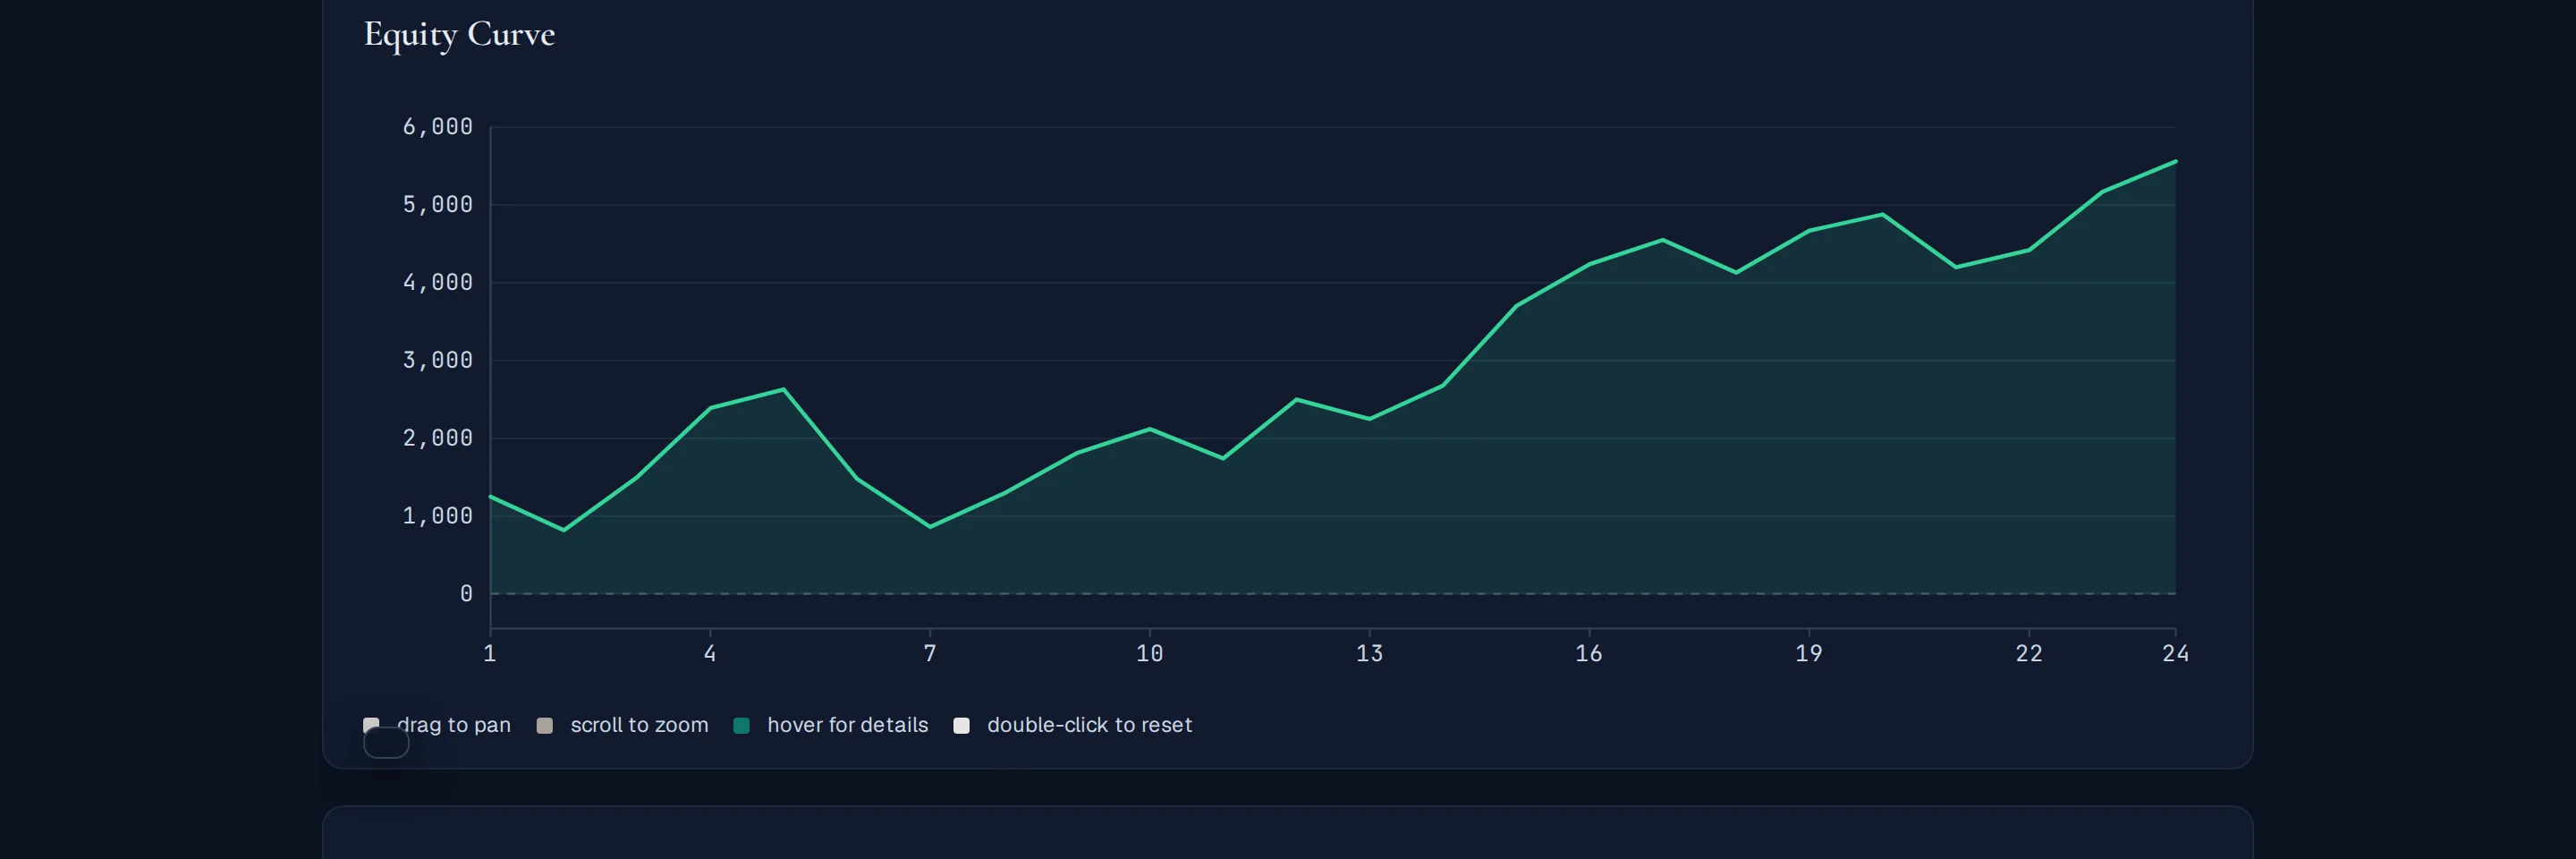
Equity curve — your P&L, trade by trade
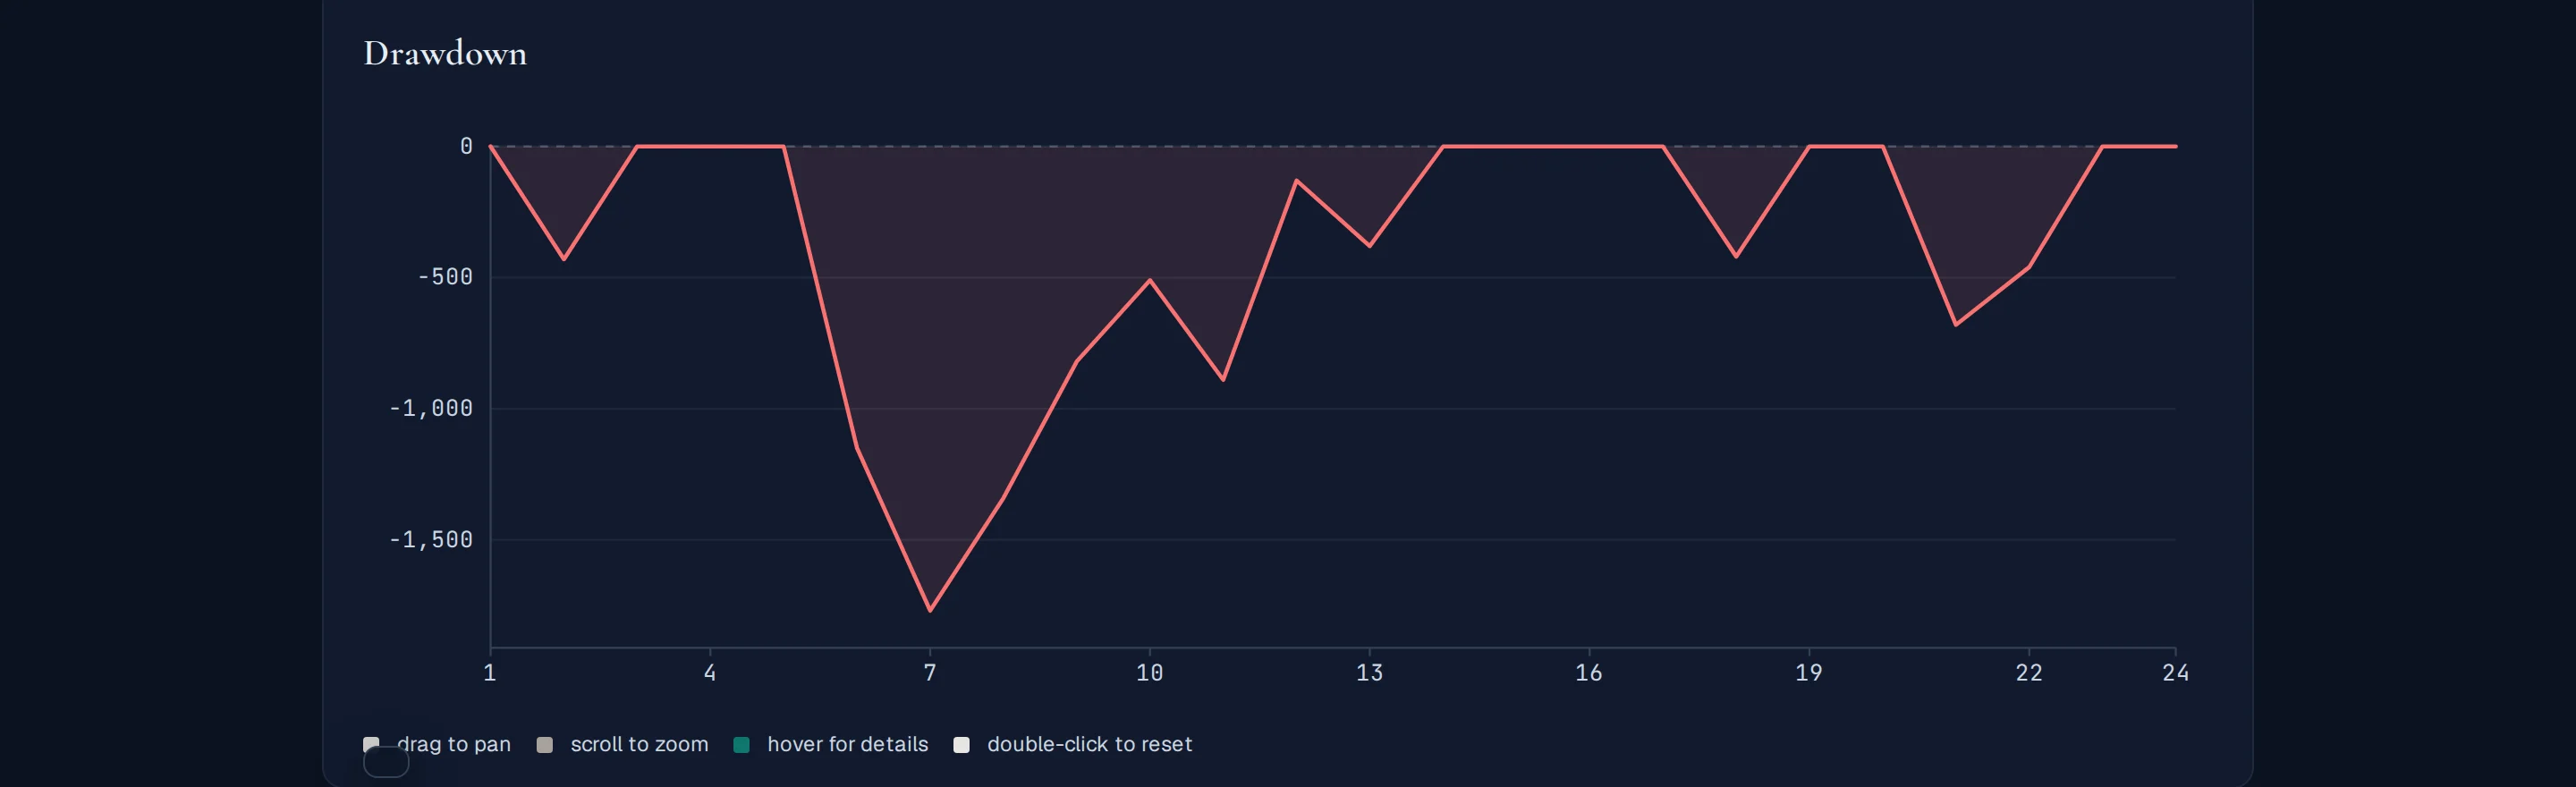
Drawdown — how deep you went underwater, and when
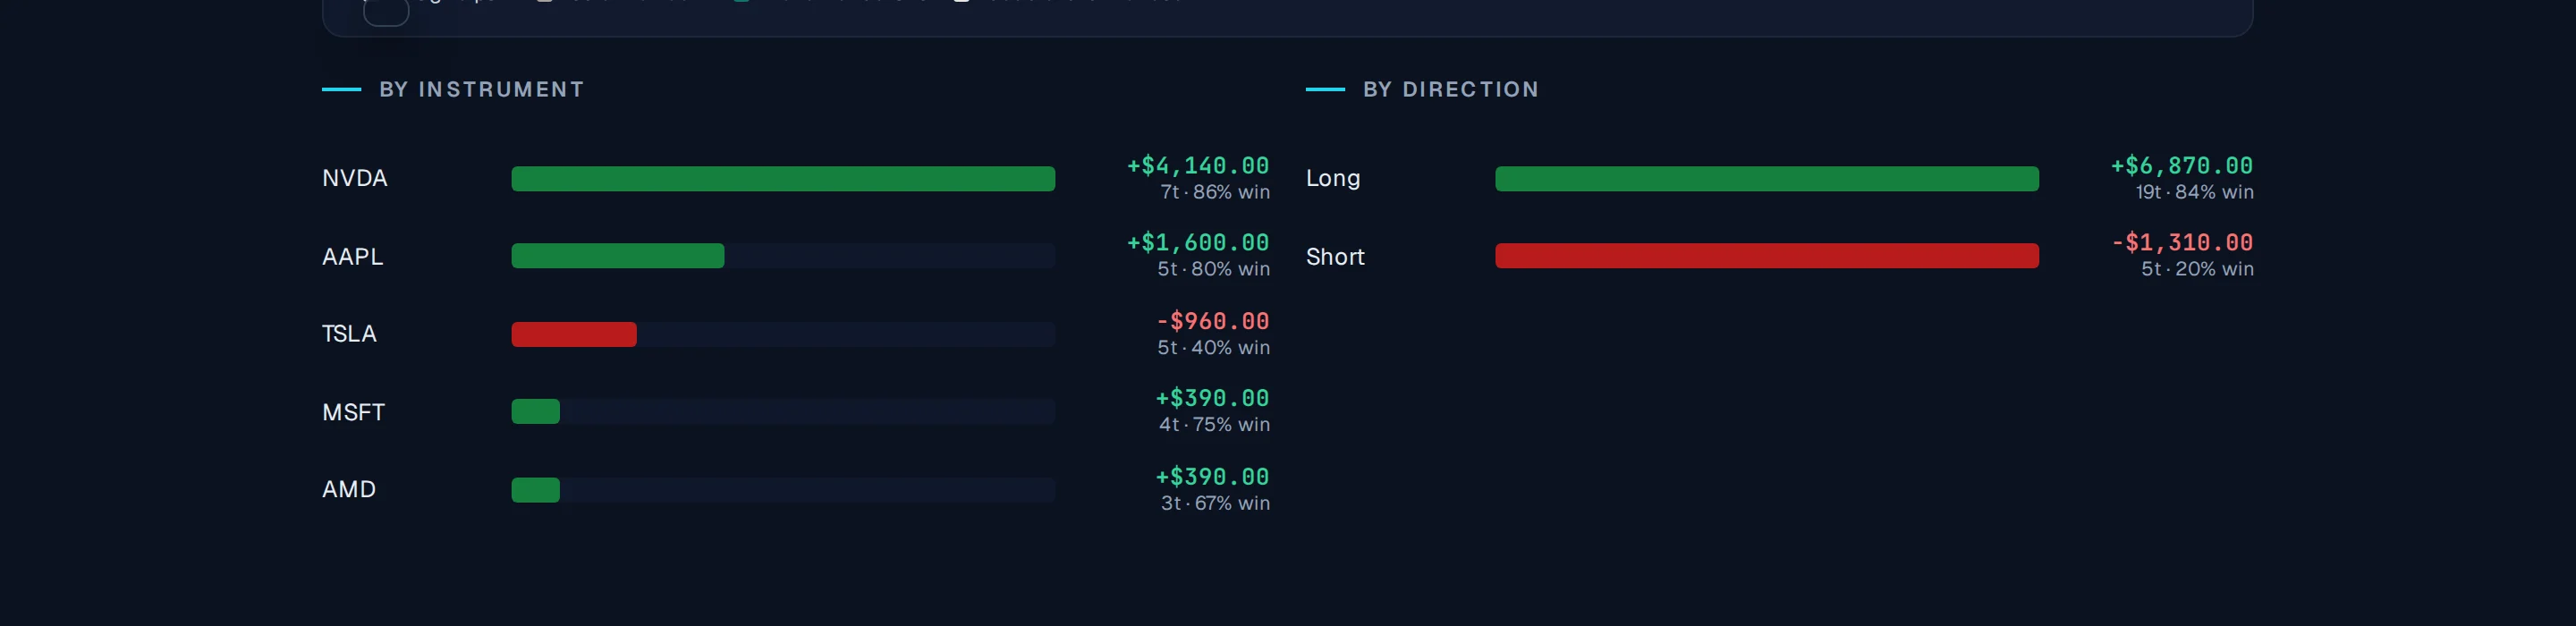
By instrument and direction — where you actually make money
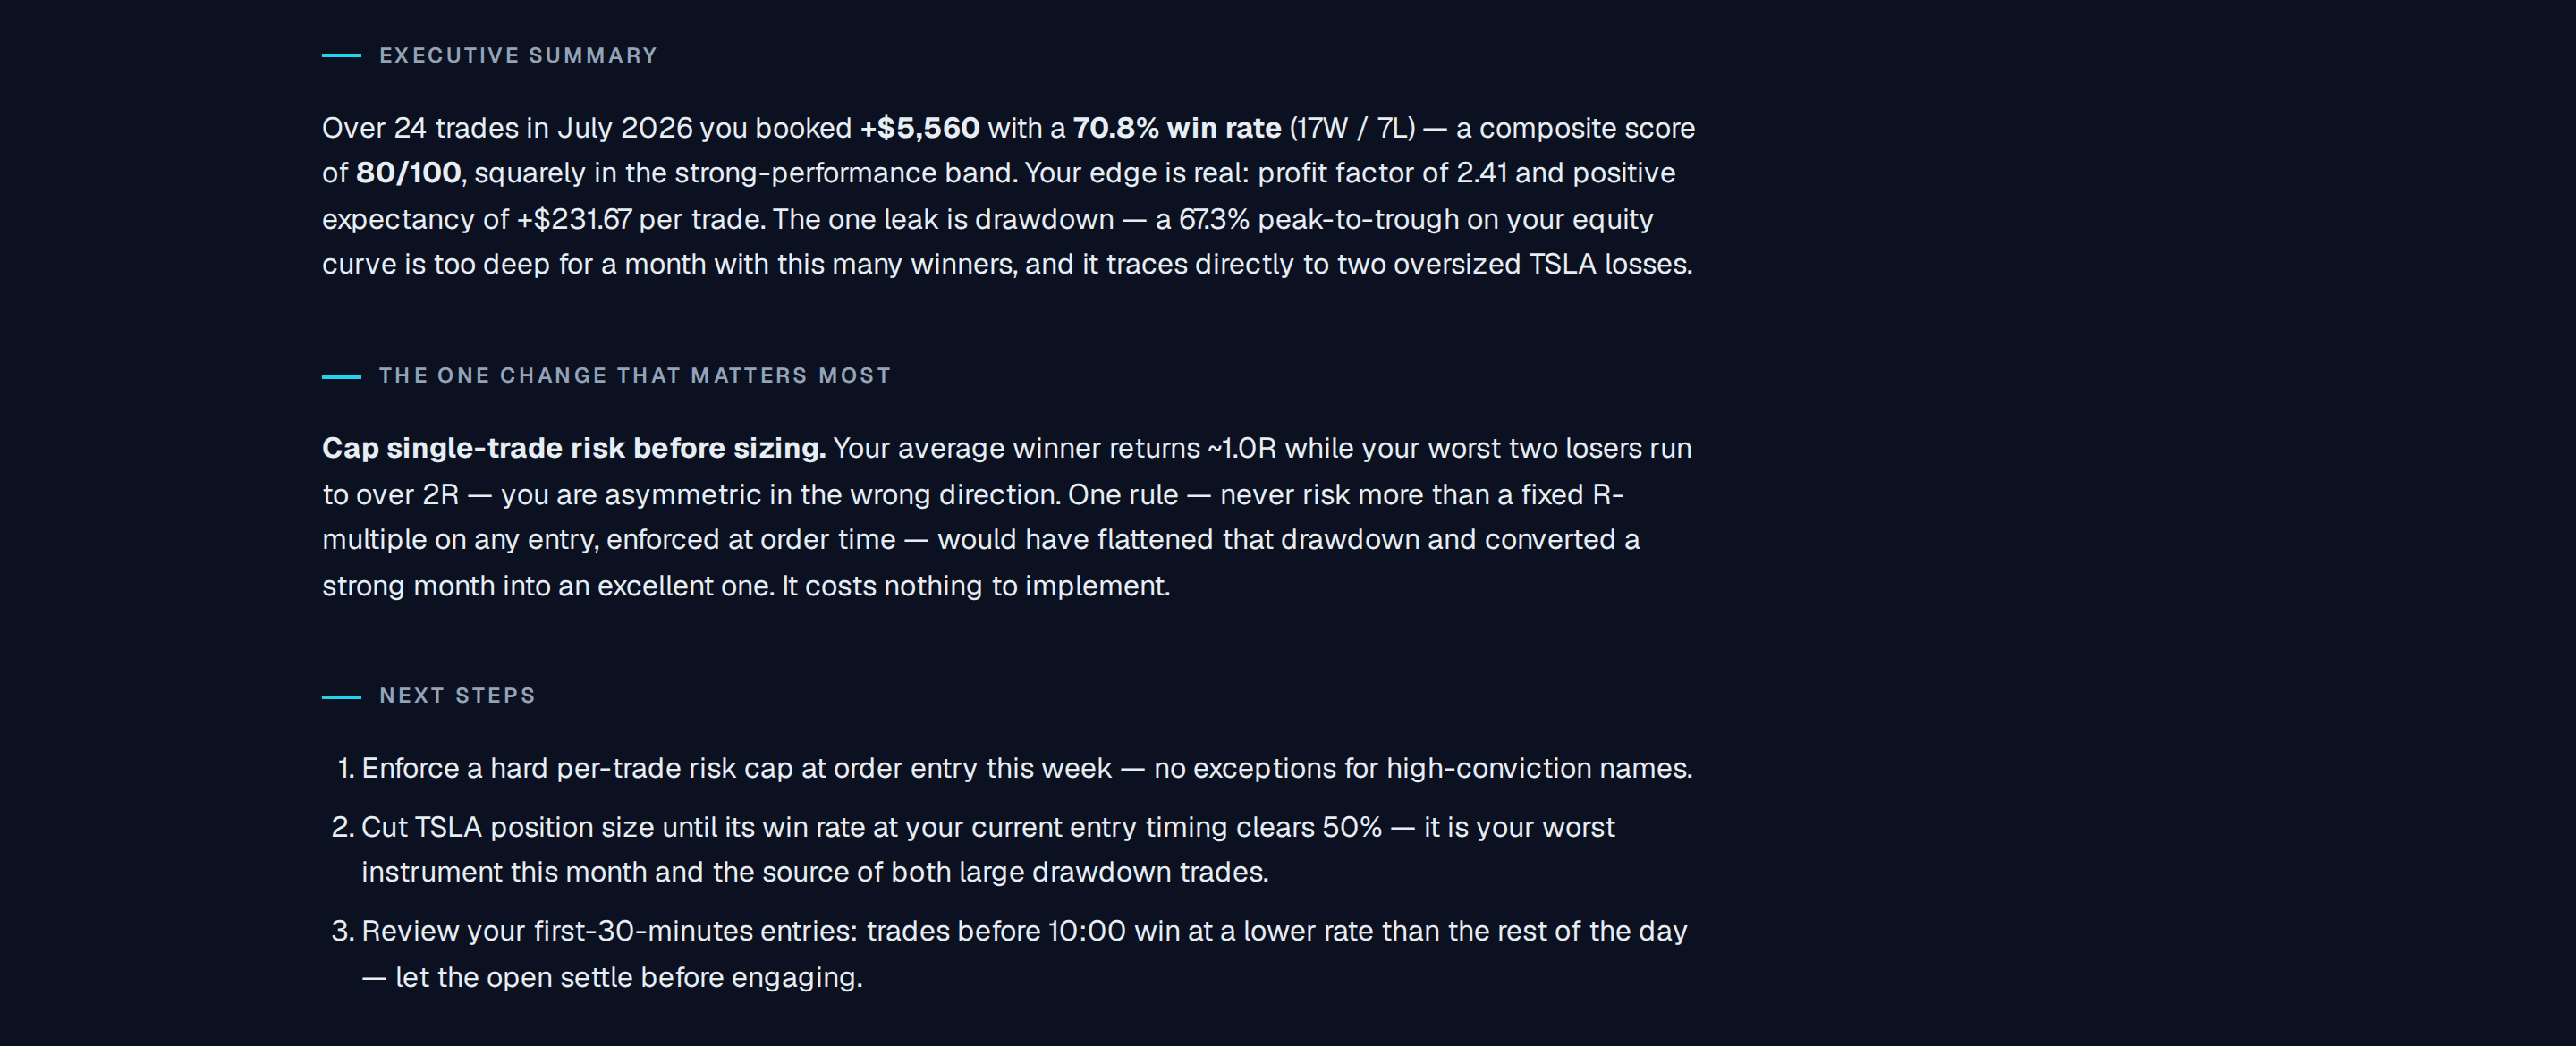
The one change that matters most
What you get
A professional HTML report (self-contained — opens in any browser, no install):
- Equity curve — your cumulative P&L visualized trade by trade
- Drawdown chart — exactly how deep you went underwater and when
- 8 KPI cards — win rate, profit factor, expectancy (in $ and R), max drawdown, composite score, avg win/loss, Sharpe-like
- By instrument & direction — where you actually make money
- Performance by hour — the exact times you trade best (and worst)
- Streaks & extremes — best/worst trade, win/loss streaks, holding periods
- Interactive charts — hover crosshair with trade details, scroll-to-zoom, drag-to-pan
- One-sentence verdict — the single highest-impact fix for your trading
The analysis framework
Built on institutional trading discipline (the same lens a professional trading desk applies to its own P&L):
- Win rate is not the story — a 40% win rate with 2.5:1 R:R is a winning system; a 70% win rate with 0.4:1 R:R is a losing one
- Expectancy is the real edge — if it's negative, no win rate saves you, and this tool will tell you directly
- Drawdown is risk of ruin — a 40% drawdown on 10 trades is a warning; on 200 trades it's a structural problem
- One change, not a list — you get the one thing that moves the needle most, not ten things you'll ignore
Supported inputs
- Broker CSV exports (symbol, P&L, direction, timestamps)
- MT5 / MT4 / cTrader statements
- IBKR activity statements
- Plain text lists:
NVDA +1250 | TSLA -430
Who it's for
- Traders who want to know if their strategy actually has an edge before sizing up
- Anyone reviewing a week, month, or strategy backtest
- Traders comparing two systems or time periods
- Disciplined traders who want the same review a desk would give them
How it works
- Paste your data or upload a CSV
- The skill parses it and computes 20+ institutional metrics (pure Python, deterministic)
- You receive a self-contained HTML report plus a written professional analysis
This analysis is for informational and educational purposes only. It does not constitute financial, investment, or trading advice. Past performance is not indicative of future results. Always consult a qualified professional before making trading decisions. This tool does not create an advisor-client relationship.


