Network Log Analyzer
Drop in your network logs — get the current status, root cause and fix, with cited log lines.
#Ingeniería#Productividad#Análisis
Valoración
Se necesitan más valoraciones
Vendidos
0
Cómo se usa
Ejecutar en Capafy
También en aplicaciones externas
Proporcionado por el publisher
Claude Sonnet 4.6
1-1. Basic information
| Field | Text to paste |
|---|---|
| Name | Network Log Analyzer |
| Tagline | Drop in your network logs — get the current status, root cause and fix, with cited log lines. |
| Category | IT operations / Networking |
| Tags | network, troubleshooting, log analysis, syslog, NOC, incident report, root cause analysis, Cisco, Juniper, Fortinet, Palo Alto, Huawei |
| Languages (mention in the description) | Reports in English or Japanese (replies in the language you write in; other languages get an English report) |
1-2. Description
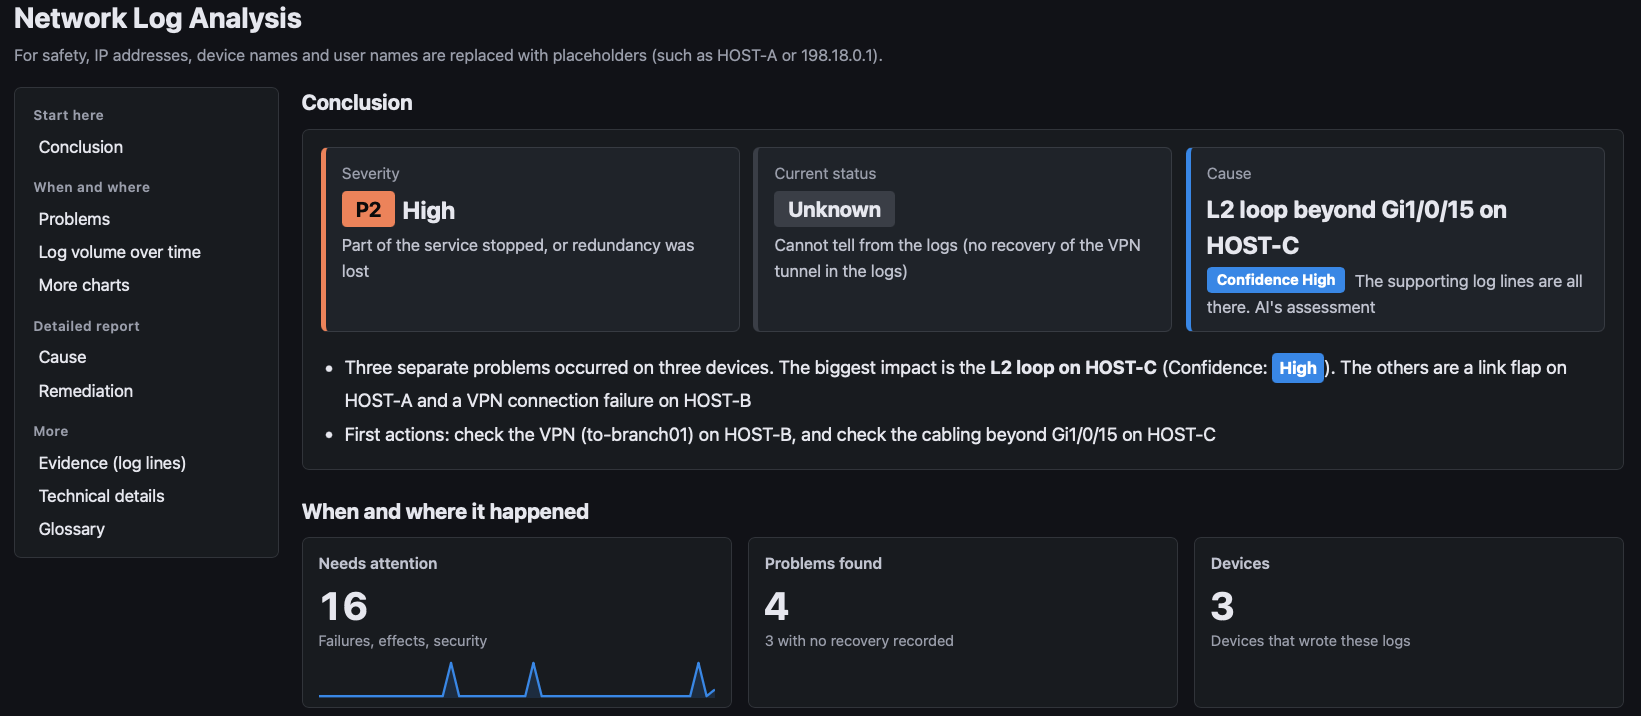
Network Log Analyzer turns raw network device logs into a clear incident report: current status, root cause, remediation, prevention and escalation advice.
Features
- Evidence you can check: every root-cause candidate cites the exact log lines and a confidence level (High / Medium / Low).
- 15 vendors, 22 platforms: Cisco (IOS / IOS-XE / IOS-XR / NX-OS), Juniper, Arista, Huawei, Fortinet, Palo Alto, HPE Aruba (AOS-CX / ArubaOS-Switch / wireless), HPE Comware, Extreme, Ruckus, NEC (IX / QX-S), Yamaha RTX, Allied Telesis (AlliedWare Plus / legacy AlliedWare), Dell (OS10 / OS9 / OS6). Other devices are analyzed as generic syslog.
- Actionable next steps: vendor-specific, read-only check commands, and fixes with impact and rollback steps.
- A report you can share: one self-contained HTML file with the conclusion, a problem list, a timeline chart and the evidence lines.
- Privacy-minded: IP addresses, device names and user names are replaced with placeholders (HOST-A, etc.) before the AI reads the log files.
- English or Japanese: replies in the language you write in (other languages get an English report). Bilingual English + Japanese reports on request.
How to use
- Attach your log files (text, CSV) or paste the logs, and ask "Analyze this".
- Get the report and the HTML file in 1-3 minutes.
- Ask for a "quick look" for a short summary, or an "incident report" for a document you can submit.
What it does not do
- It never connects to your devices or runs commands. It only suggests them.
- It cannot see what is not in the logs. Missing information is listed under "Additional checks".
- The report is an estimate based on the logs. Your operators should decide before changing any configuration.
2. Notes
Notes
- Sensitive logs: masking is applied to log files before the AI reads them. Text pasted directly into the chat reaches the AI as-is. If your logs must not leave your organization, check your internal policy first and send them as files.
- The table that maps placeholders back to the original values is deleted automatically when the report is finished. If you need a report with the original values, ask for it in your first message.
- Some formats, platforms and versions are not supported or not yet verified. These are stated under "Limitations" in each report.
Screenshots