RateRadar — Live Freelance Rate Benchmarking
RateRadar — Autonomous Freelance Pricing & Market Intelligence
Stop guessing your worth. RateRadar researches market benchmarks for your exact skill set, experience level, and geographic target, transforming guesswork into a precise, visual, and downloadable pricing report.
⚡ The Pricing Problem
Pricing freelance or consulting work is one of the hardest parts of self-employment. Rates for the exact same skill can swing 2x to 3x based on experience, location, and niche. Most professionals set their rate once—off a random number seen in a forum post or outdated blog—and never revisit it with real data.
RateRadar eliminates the guesswork. Provide your role details, and it delivers a defensible, data-backed benchmark instantly.
💡 How to Use RateRadar
To get the most accurate report, provide the following details in your prompt:
- Core Skill / Role: (e.g., UX Designer, Full-Stack Developer, Copywriter)
- Experience Level: (e.g., 3 years, Senior, 8+ years)
- Target Market / Location: (e.g., US Remote, Western Europe, Local Market)
- Current or Target Rate (Optional): (e.g., $65/hr or $5,000 project retainer)
🚀 Key Features
- Market Benchmark Search: Queries live web data and verified industry salary/freelance databases tailored to your specific skill, experience, and location combination.
- Visual Distribution Chart: Plots your current rate against real percentile bands (25th, median, 75th, and 90th percentiles) so you can see your market standing at a glance.
- Standalone HTML Export: Generates a downloadable, self-contained HTML report with the chart embedded—ready to attach to a client email or archive for your records.
- Smart Overrides: Accepts your own custom rate data or proprietary sources as an override if you prefer not to rely solely on automated web lookups.
- Total Transparency: States data sources and recency directly in the report header—no buried fine print.
- Graceful Fallbacks: Refuses to force a benchmark for ultra-niche or thin data categories, clearly stating data limitations rather than hallucinating ranges.
📦 What's Inside the Report
RateRadar operates on a zero-turn protocol—no preamble or fluff, just immediate intelligence:
- Precision Header:
[Skill] · [Experience] · [Market] · [Rate Type] — benchmarked against [Source], as of [Date]. - Visual Rate Chart: A clear horizontal distribution band mapping the market spread from the 25th to the 90th percentile, highlighting your exact position.
- Percentile Breakdown: Concrete numerical figures for the 25th, median, 75th, and 90th percentiles.
- Actionable Observation: A concise analytical takeaway (e.g., "Your rate sits at the median, with room to move toward the 75th percentile as you take on senior-scope projects").
- Downloadable Artifact: A self-contained HTML report file.
- Clean Disclaimer: A single-line market-data notice.
💼 Who Is This For?
- Freelancers Ready to Scale: Deciding whether and how much to raise rates for incoming clients.
- Consultants & Agencies: Preparing proposal pricing and needing a defensible benchmark to justify project fees.
- New Entrants: Transitioning from full-time employment to freelancing with zero baseline knowledge of what to charge.
- Contract Renewal: Walking into rate negotiations armed with current market data rather than last year's assumptions.
- Agency Owners: Fairly benchmarking compensation rates for subcontracted talent.
🧪 Sample Execution Preview
Input Example:
"I'm a freelance UX designer with 5 years of experience, working remotely with US clients, currently charging $65/hour. Is that a fair rate?"
Output Summary:
- Header:
UX Design · 5 years experience · US remote market · Hourly - Distribution Mapping: Plotted against a US remote median of ~$65/hr and a 75th percentile ceiling of ~$95/hr.
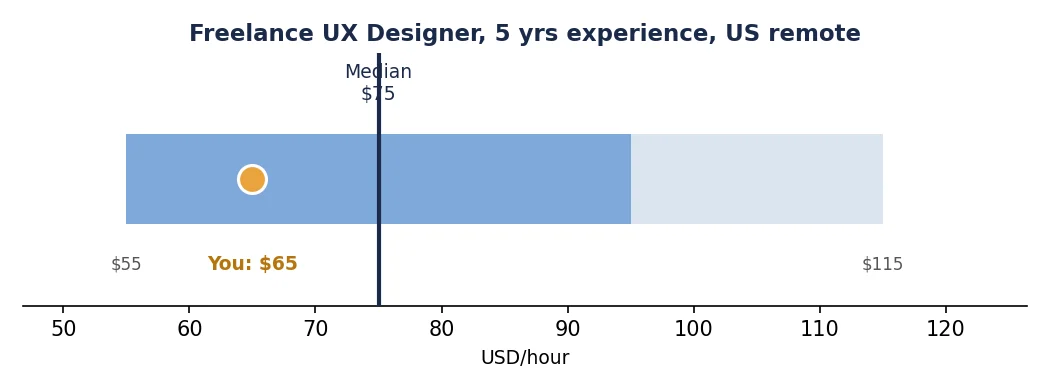
- Takeaway: Your rate sits at the market median—reasonable, with clear headroom for senior-tier projects.
🔍 Honest Limitations
- Niche Data Gaps: For hyper-niche or emerging skills, market data may be thin. RateRadar states this limitation transparently rather than forcing a mismatched benchmark.
- Broad Market Baseline: Percentiles reflect broad market data, not your individual reputation, bespoke portfolio, or a specific client's internal budget constraints. Use it as a starting reference point for negotiation.
- Data Lag: Fast-moving tech stacks or economic shifts can cause slight data lag; source dates are always displayed so you can judge currency for yourself.