
SheetDash | Excel Dashboard from CSV or XLSX
Your spreadsheet, back as a live Excel dashboard
Most "analyze my spreadsheet" tools give you a report you can only read. When the numbers change next week, you start over.
SheetDash gives you an Excel file you keep working in. Upload an .xlsx or .csv and write one line about what you want to see. You get back one workbook: your data as a filterable table, summary sheets where every number is a real formula, native Excel charts, and a Dashboard sheet with KPI cards and a short written summary. Edit a value or paste new rows into the table and the summaries and charts follow.
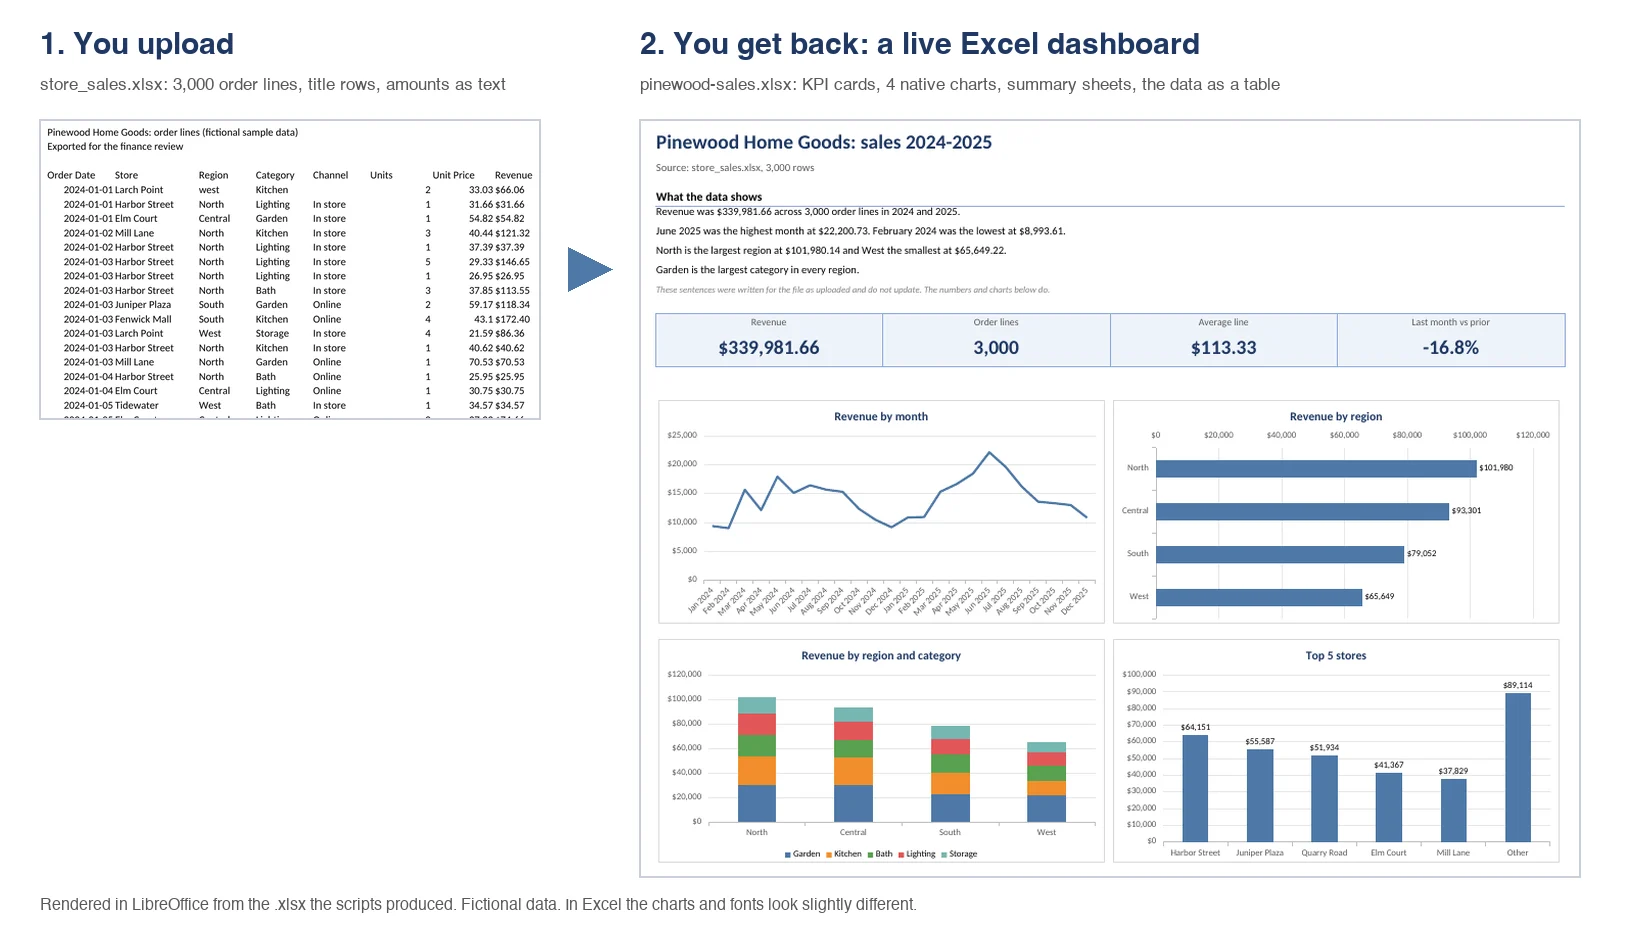
Left: the uploaded file, as the sample data came (fictional store sales, 3,000 order lines). Right: the Dashboard sheet of the delivered workbook. Both pictures were rendered in LibreOffice from the real files; Excel draws charts and fonts slightly differently.
How you use it
Show monthly revenue by region, the top 5 stores, and revenue by region and category.
Upload the file once per conversation and write what you want to see. No request? The agent picks a sensible overview (a trend over time, the top groups, one two-way breakdown) and tells you what it chose. Column names and your request can be in any language, and the sheet names and labels follow your language.
What you get
| Sheet | What it is |
|---|---|
| Dashboard | Title, 3 to 5 sentences on what the data shows, KPI cards, and 2 to 4 native Excel charts |
| Summary sheets (3 to 5) | Pivot-style tables built from SUMIFS, COUNTIFS and AVERAGEIFS formulas: by month, by group, group by group. Each ends with a Total, "All rows in Data" and a Difference line, so a missing group or a blank date shows up instead of hiding |
| Data | Your data cleaned, as an Excel table named tblData with filter buttons. Helper columns (month, quarter and so on) are formulas that Excel fills in for new rows |
| Notes | Source file, what each column was read as, and every cleaning step |
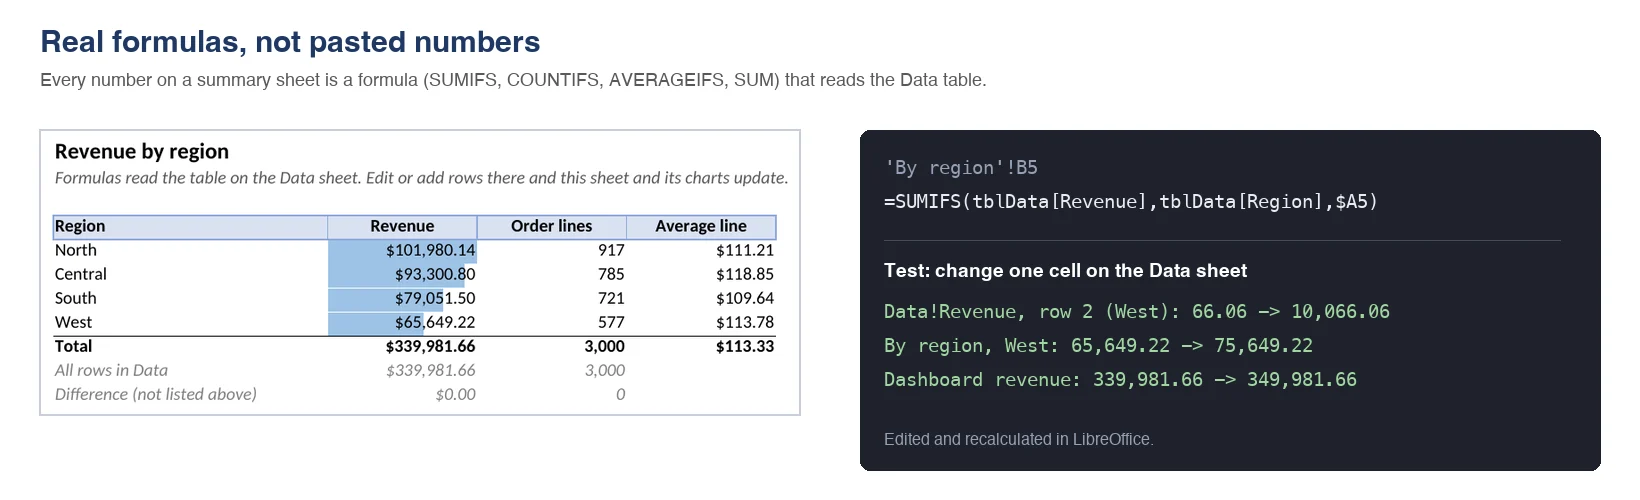
The formula in a summary cell, and a test: one Revenue cell on the Data sheet was changed by 10,000. The West row, the by-region table and the Dashboard KPI each moved by exactly 10,000 after recalculation.
How it works
- Reads and cleans your file. Finds the header row under title lines, drops a "Total" row at the bottom so it is not counted twice, reads amounts like
$1,234.50,1.234,50,34,900원or(120.00), reads dates like2025-03-05,5 Mar 2025,03.04.2025or2025년 3월 5일, merges spellings that differ only by capitals, and names blank groups "(blank)". Nothing is edited silently: the Notes sheet lists every change. - Plans the dashboard. The AI chooses summaries, chart types and KPI cards from your request and your columns, and writes the short summary in your language.
- Builds the workbook. A script writes the table, the formulas and the native charts. Numbers are never pasted as constants.
- Checks it before you see it.
- Every formula is read back from the file, calculated again from the workbook's own data, and compared with the value the file displays.
- Error values, empty charts, charts that point at the wrong cells and pictures in place of charts are rejected.
- Numbers in the written summary must exist in your data (a share or difference the AI calculated is listed with how it was calculated).
- Filler wording and emoji are rejected.
A workbook with an open warning is fixed and rebuilt, not delivered.
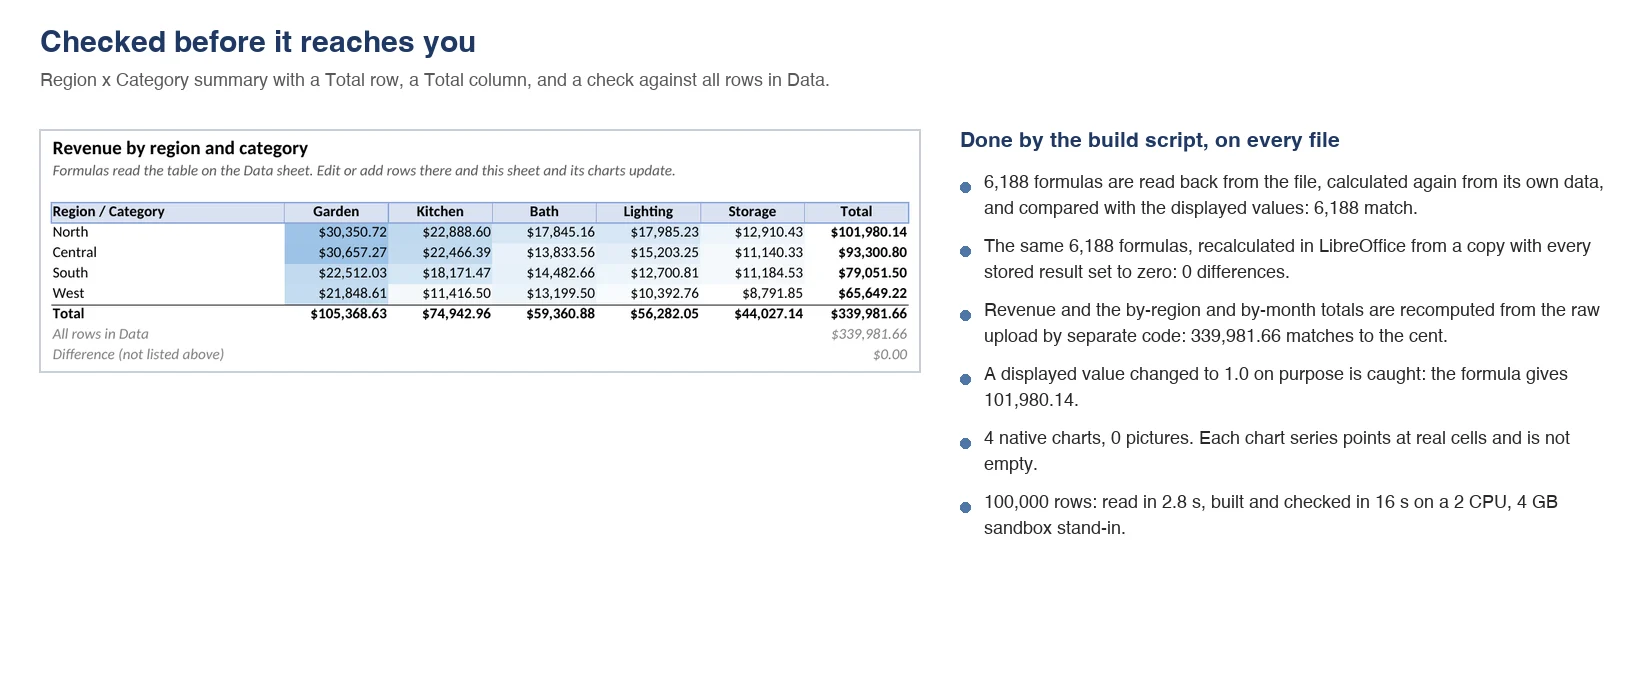
On the sample file: 6,188 formulas read back and calculated again, all 6,188 matched. The same formulas recalculated in LibreOffice from a copy with every stored result set to zero: 0 differences.
Messy exports are fine
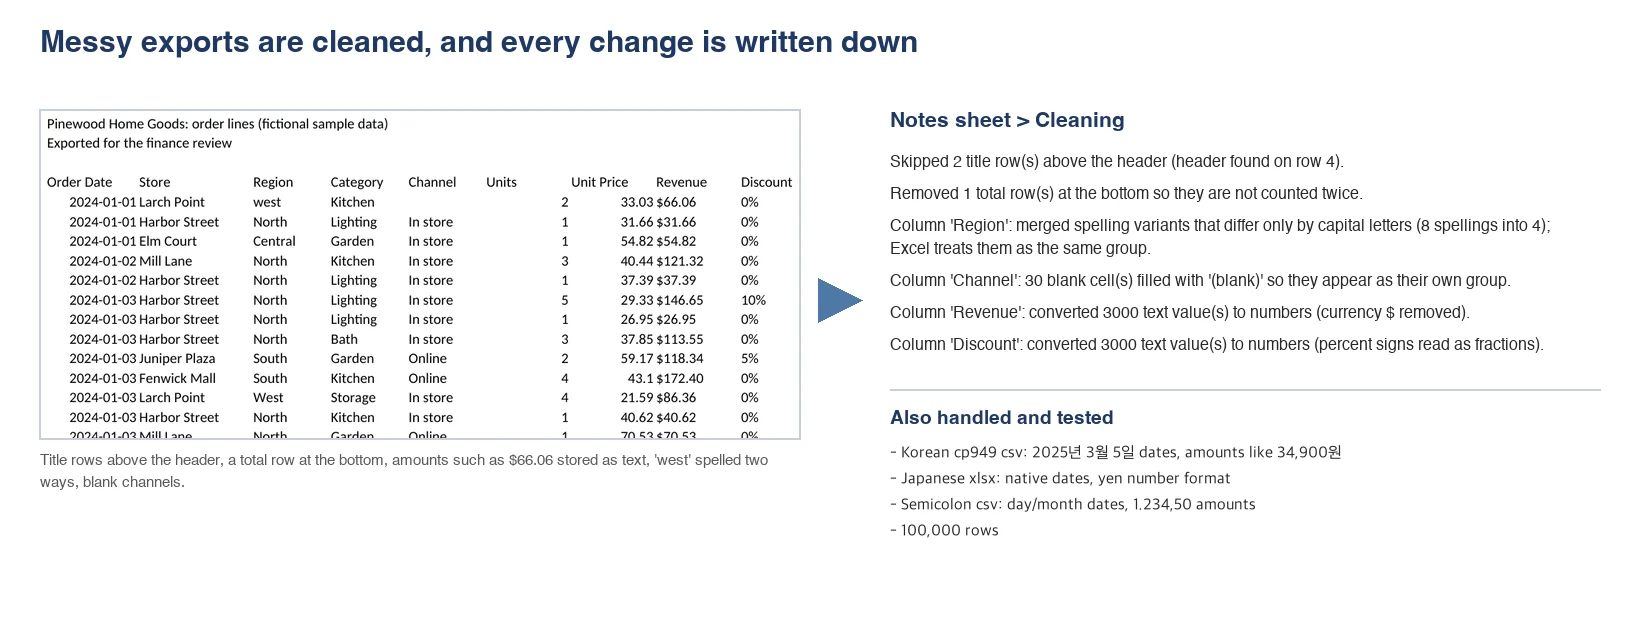
Title rows, a total row, amounts stored as text, 'west' and 'West', blank cells: handled and written down on the Notes sheet. Also tested: a Korean cp949 .csv with Korean headers, 원 amounts and 2025년 3월 5일 dates; a Japanese .xlsx with yen cells; a semicolon .csv with day-first dates and comma decimals; group names containing * ? ~ = < characters; 100,000 rows.
Timing
Measured on a local copy of the sandbox (2 CPU, 4 GB): a 3,000-row file is read in about 0.3 seconds and built and checked in about 1 second. A 100,000-row file is read in about 3 seconds and built and checked in about 16 seconds. Most of the time per request is the AI reading your columns and writing the plan and the summary.
Plans and limits
| Plan | Price | Requests |
|---|---|---|
| Daily | $3.99 | 5 per day |
| Weekly | $5.99 | 8 per week |
| Monthly | $14.99 | 20 per month |
Every message you send uses 1 request from your plan.
What this agent doesn't do
- Give advice. The summary states what the data shows: largest, smallest, change, share. No forecasts, no causes, no recommendations to buy, sell or hire.
- Add numbers that are not in your data, or edit your values. Cleaning steps are listed on the Notes sheet.
- Make pivot tables, slicers, macros, scatter plots or combo charts. Charts are column, stacked column, bar, line, area and pie.
- Build several data tables in one workbook. If your file has several sheets, it picks one and tells you which.
- Read password-protected files, old .xls files or scanned images. Save as .xlsx or .csv.
- Keep the written summary up to date. Those sentences are about your file as uploaded; the numbers, tables and charts update, the sentences do not.
- Handle more than 200,000 rows or 2.5 million cells.
FAQ
Q. Does it open in Excel? The file uses standard Excel tables, formulas and charts, written with the XlsxWriter library. We verified it by recalculating in LibreOffice and with our own formula check. Excel desktop was not part of our test run, and we did not test Google Sheets, where tables with structured references can import differently.
Q. What happens when I add rows? Paste or type them at the bottom of the Data table. Excel grows the table, fills the helper columns, and the summaries and charts recalculate. A new group name that is not listed on a summary appears under Other or in the Difference line; add a row there and copy the formulas down to list it.
Q. Can it change a chart or add a breakdown afterwards? Yes. Ask in the same conversation ("make it quarters", "top 5 only", "add revenue by channel"). Each message uses 1 request and rebuilds the file.
Q. How sure can I be of the numbers? Each formula is calculated twice: once by the build script, and once by a separate checker that reads the formula text back from the file. The two must agree. The Difference line on every summary shows whether the listed groups add up to all rows. The written summary only states numbers found in your data.
Q. Does my file leave the workspace? No. Your file is processed inside the agent's cloud workspace. The only download is two Python packages from PyPI, once, if they are not already there.
Q. Questions? [email protected]
API externas
pypi.org, files.pythonhosted.org