Stock Price Decoder—What the Market Is Pricing In
Stock Price Decoder: What the Market Is Pricing In
Every share price contains a bet on the future. This Agent makes that bet visible.
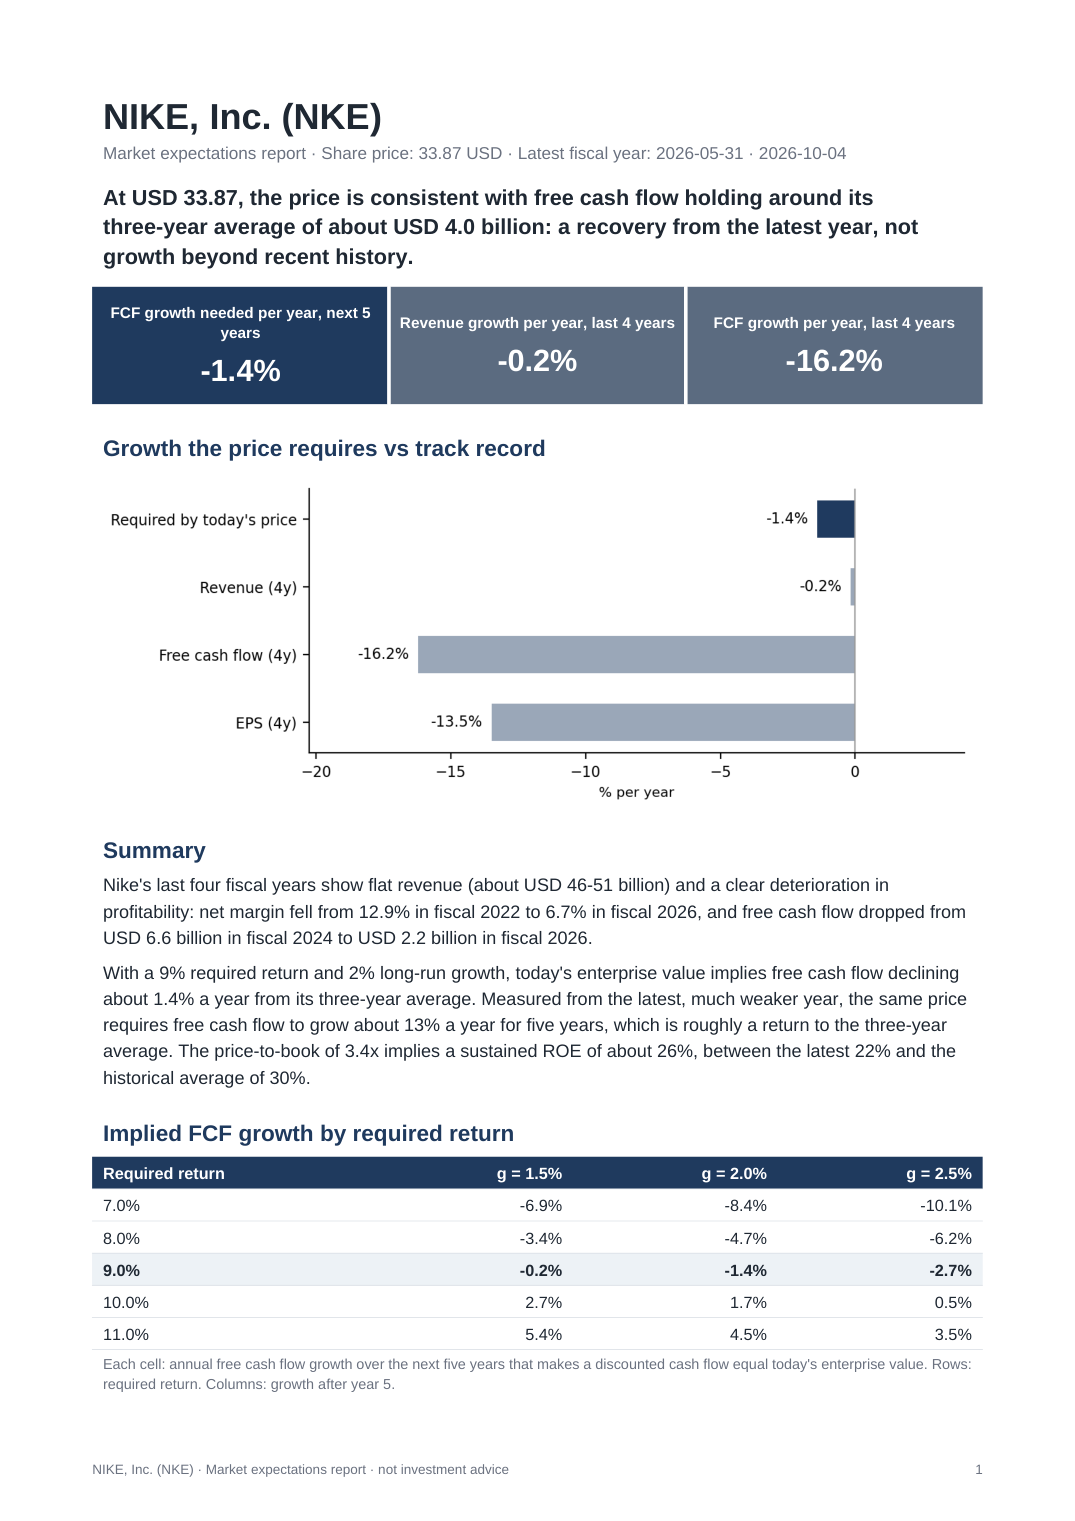
Give it a company and today's share price: it reads the company's official SEC filings and shows what growth and returns the market needs to see to justify that price, and how that compares with what the company has actually delivered over its last five fiscal years.
[IMMAGINE: stock_example_page1.png]
What you get
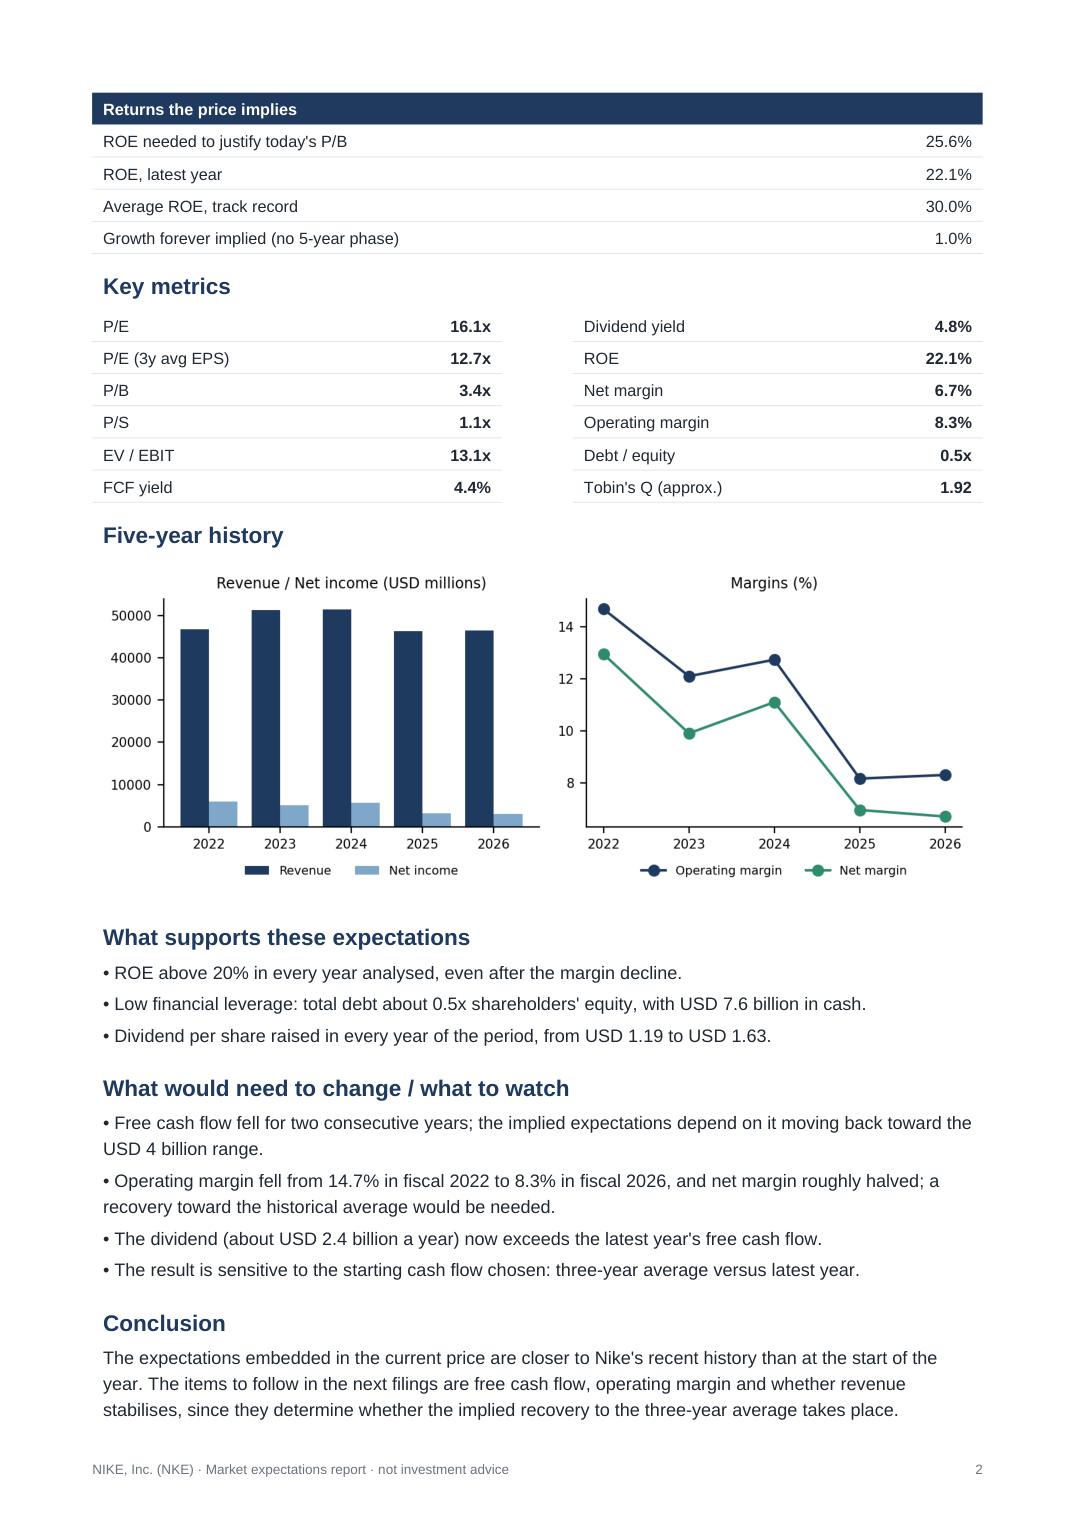
- A PDF report: the cash flow growth the price requires compared with the company's track record, a sensitivity table, the return on equity implied by the price, key multiples, five-year charts, and a plain-language reading of what supports or challenges those expectations.
- An Excel workbook with live formulas: change the price, the required return or the long-run growth and everything recalculates. You can also test your own growth assumption and see whether it is above or below what the price requires.
[IMMAGINE: stock_example_page2.png]
What it calculates
- P/E (latest and three-year average EPS), P/B, P/S, EV/EBIT, free cash flow yield and dividend yield
- ROE, operating margin, net margin, debt/equity, Tobin's Q (approximate)
- Reverse DCF: the annual free cash flow growth over the next five years implied by today's enterprise value
- ROE implied by today's price-to-book ratio
- Growth of revenue, free cash flow and EPS over the last five fiscal years
Data
- Financial statements come from SEC EDGAR, the official XBRL data of annual reports filed with the US Securities and Exchange Commission.
- Works for companies that file annual reports with the SEC, including foreign companies that report there.
- You provide the share price, so the analysis always uses the price you see.
- If a company does not report operating income or total liabilities in the standard format, they are derived from its other reported figures (pre-tax income and net interest; total assets minus equity) and flagged in the workbook notes.
- Handles a share price quoted in a different currency from the accounts, and ADRs.
Example
Input: "Analyze NKE, price 33.87 USD"
Output: a 3-page PDF report, an Excel workbook and a short summary in chat.
In this example (NIKE, Inc., closing price of 2 October 2026, fiscal year ended 31 May 2026), the analysis shows that the price is consistent with free cash flow holding roughly around its three-year average of about USD 4.0 billion, after two years of decline, with an EV/EBIT of 13.1x and a price-to-book that implies a ROE of about 26%, compared with 22% in the latest year.
What's included and how usage is counted
Each monthly subscription includes up to 15 company analyses and up to 100 messages, whichever limit is reached first.
- Company analysis: one full analysis of one company, with the PDF report and the Excel workbook. Analysing the same company again in the same month (for example with an updated price) does not count as a new analysis.
- Message: every message you send to the Agent counts as one message, including the request that starts an analysis and any follow-up questions. A typical analysis uses 2 to 4 messages.
- Both counters reset at the start of each billing cycle. When a limit is reached, the Agent tells you and you can continue in the next cycle.
FAQ
Does it tell me whether to buy or sell?
No. It shows what the current price implies and how that compares with the company's history. It gives no price targets and no buy, sell or hold recommendations.
Which companies are covered?
Companies that file annual reports with the SEC. Companies listed only outside the US that do not file with the SEC are not covered.
How recent is the data?
The analysis uses annual filings, so the most recent quarter is not included. The report always states which fiscal year was used.
Can I change the assumptions?
Yes. Price, currency, required return and long-run growth are editable in the Excel workbook, and every formula is live.
Why do I need to give the share price?
So that the analysis uses exactly the price you are looking at, instead of a delayed or estimated one.
Disclaimer
Informational and educational analysis based on public filings. It is not investment advice and not a recommendation to buy, sell or hold any security. Figures are generated automatically from public data: check them against the original filings before making any decision.
API externas
data.sec.gov · www.sec.gov