Trading Journal: Win Rate, Expectancy and P&L
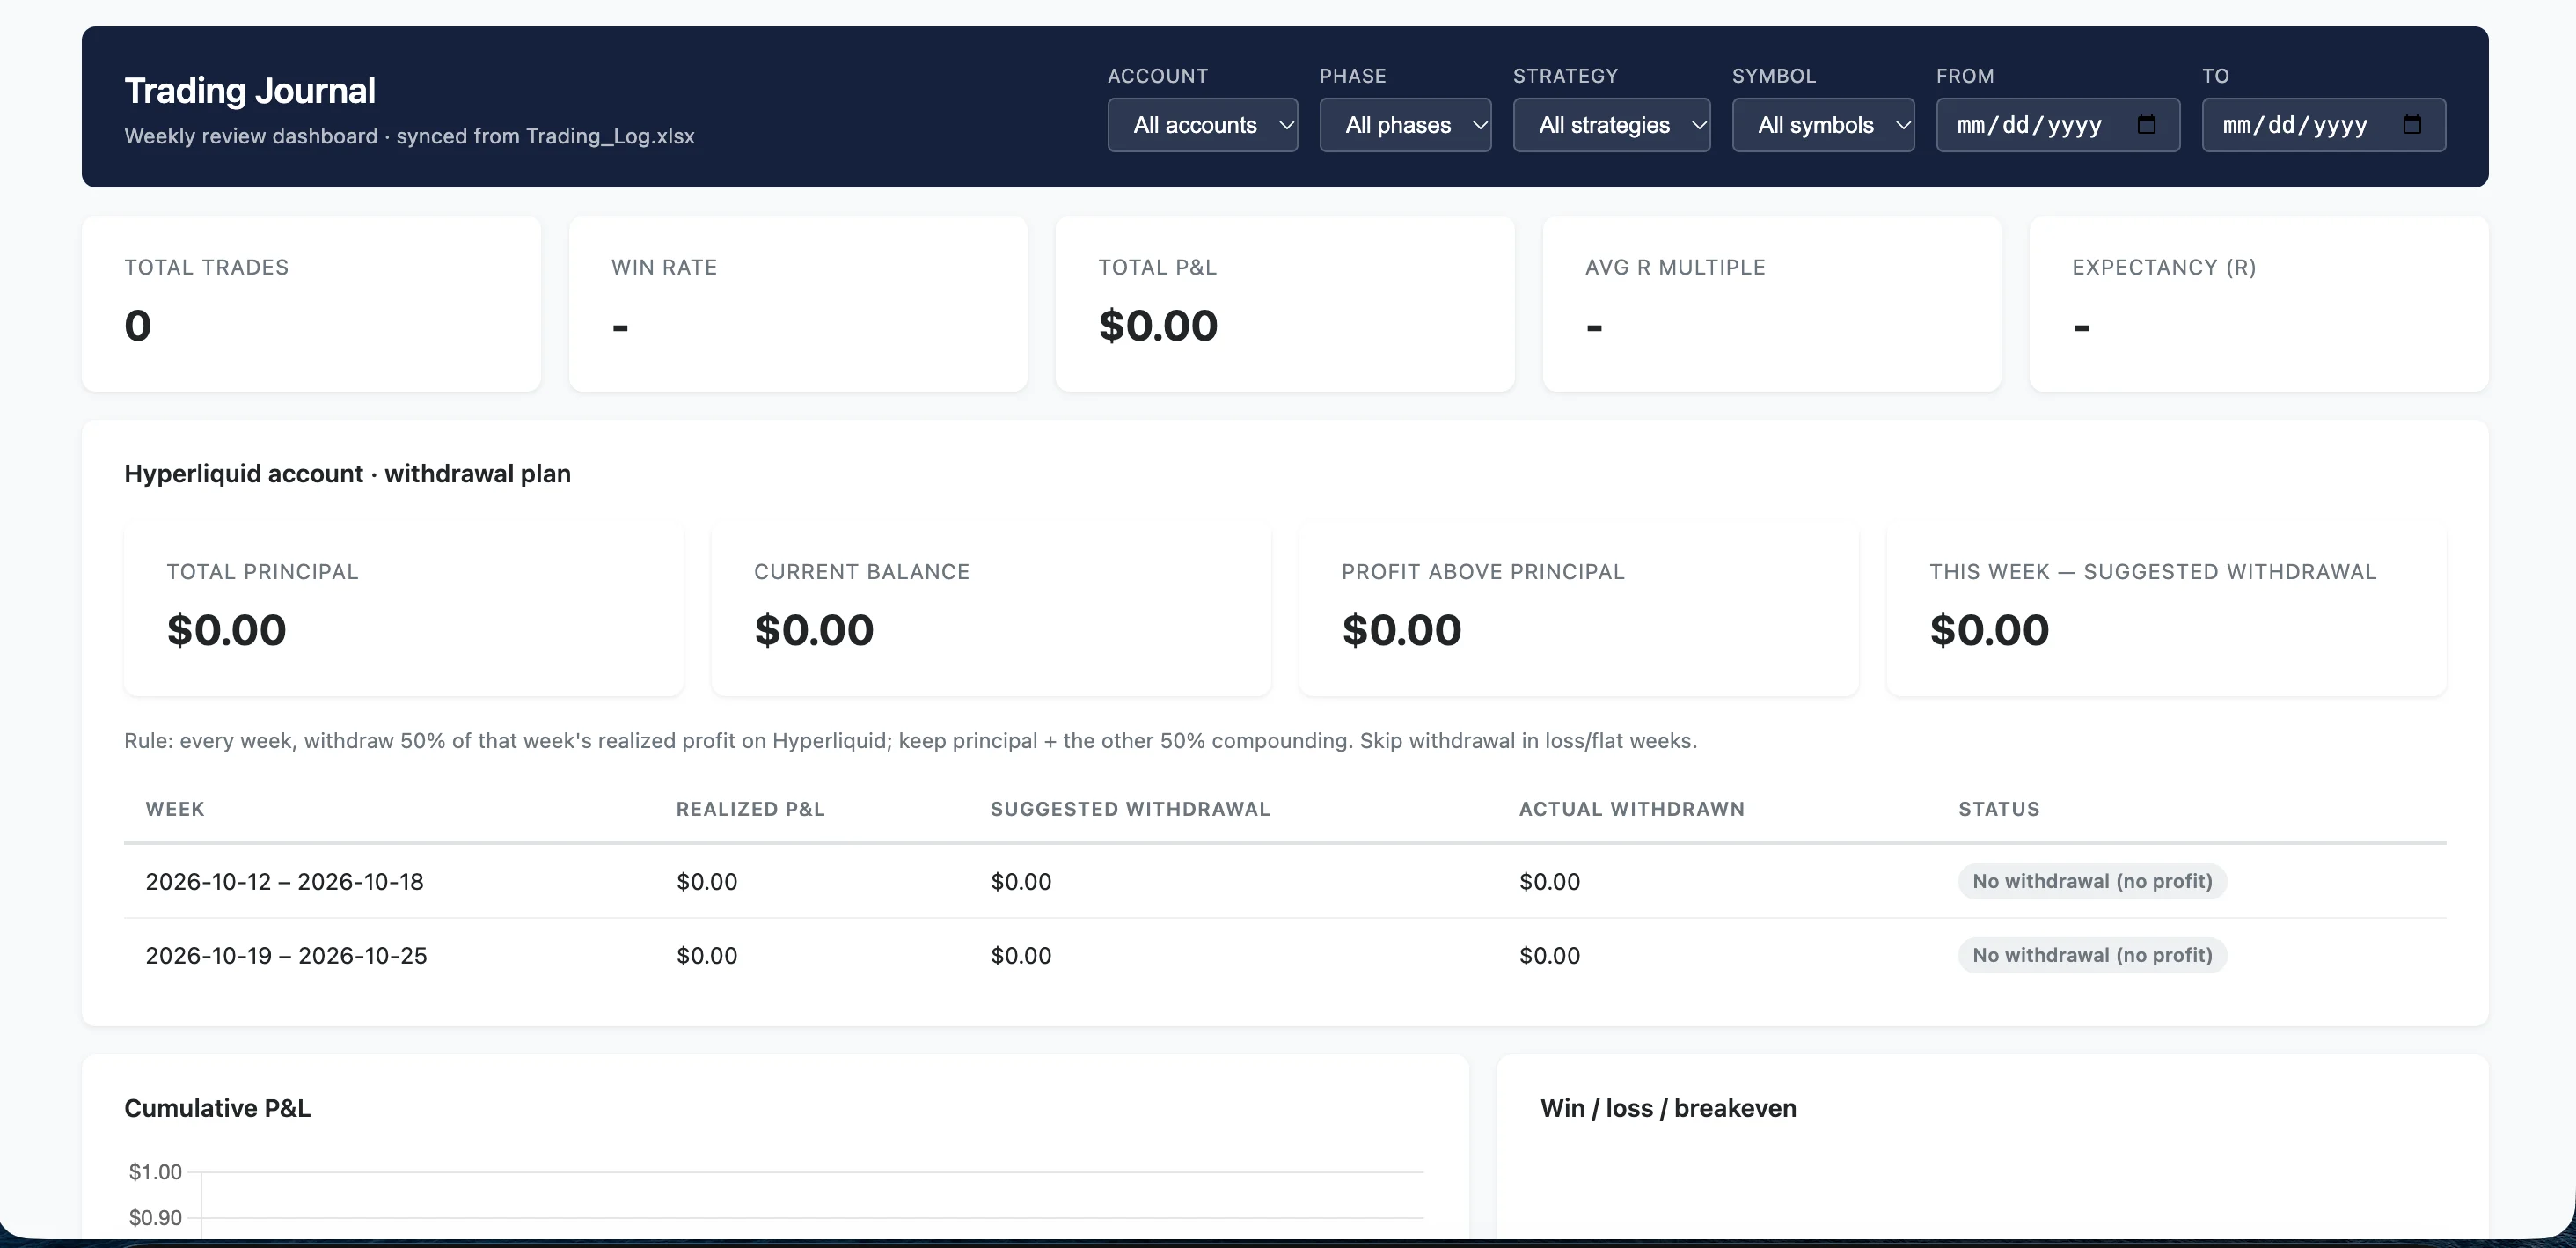
A single-file trading journal dashboard that turns every trade into data. See win rate, average R multiple and expectancy at a glance, so you know if a strategy really works. Filter by account, phase, strategy, symbol or date. Track cumulative P&L, profit by symbol, and weekly results. Live accounts get balance, profit above principal, and suggested weekly withdrawals at a percentage you set. Sortable trade log, no signup, no install. Your data stays with you. A tool for review, not advice.
#Finances#Recherche#Analyse
Note
Davantage d’évaluations nécessaires
Vendus
0
Mode d’utilisation
Télécharger
Placing trades is the easy part. Seeing your own patterns clearly is hard. This trading journal dashboard turns every trade into data you can actually review:
- Key metrics at a glance: total P&L, win rate, average R multiple and Expectancy, so you can tell whether a strategy has a real edge instead of relying on win rate alone
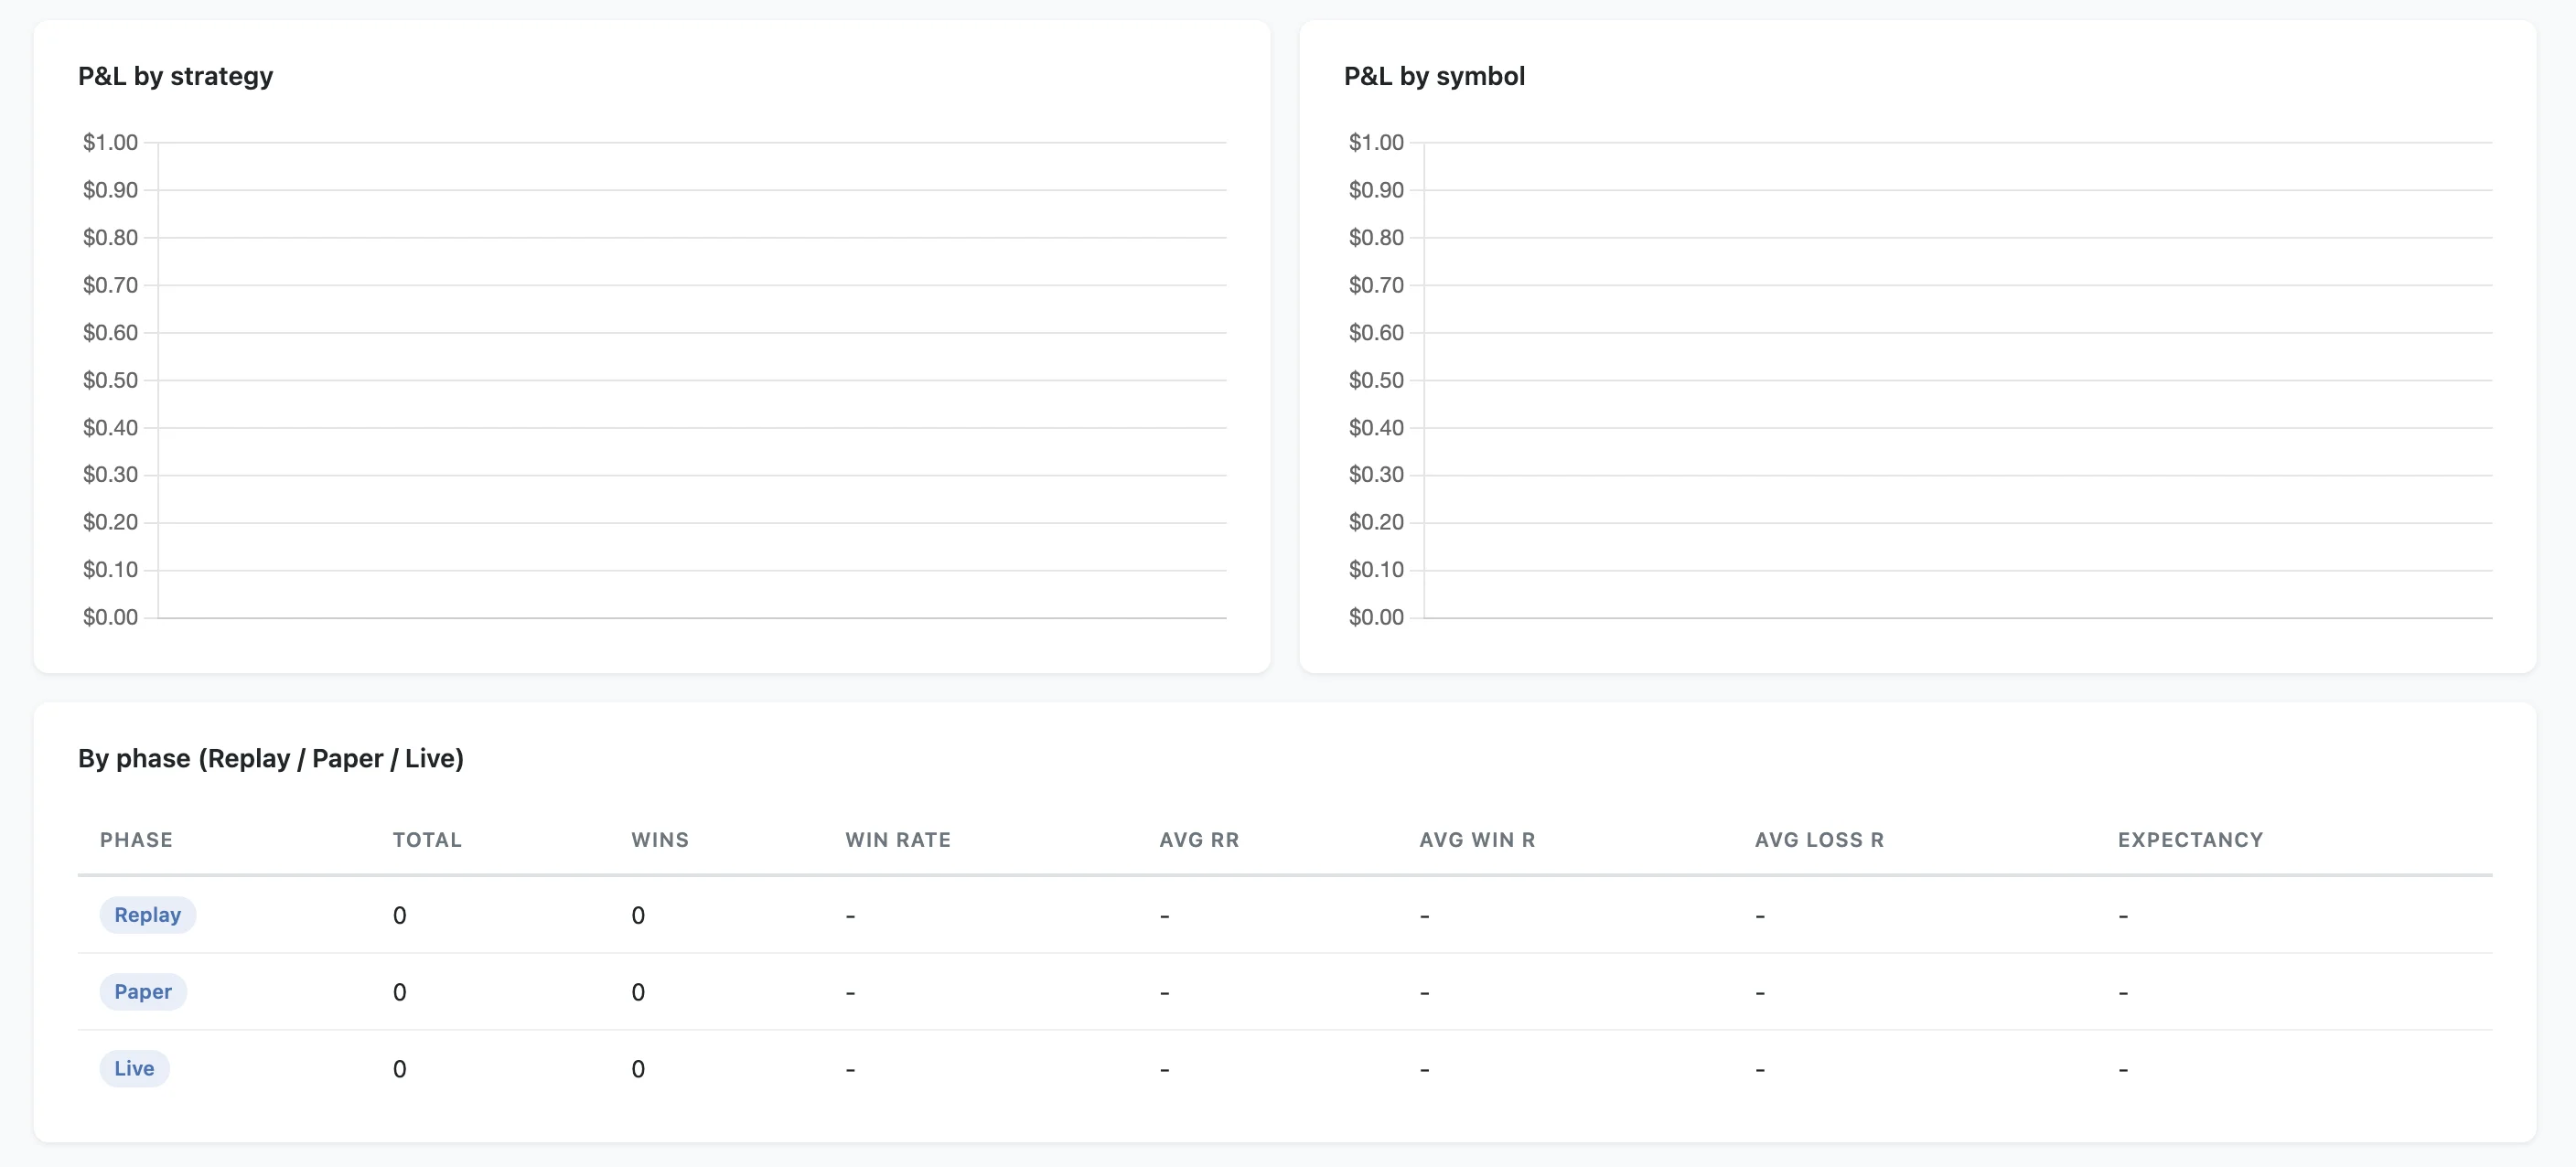
- Flexible filters: switch by account, phase (Replay / Paper / Live), strategy, symbol and date range
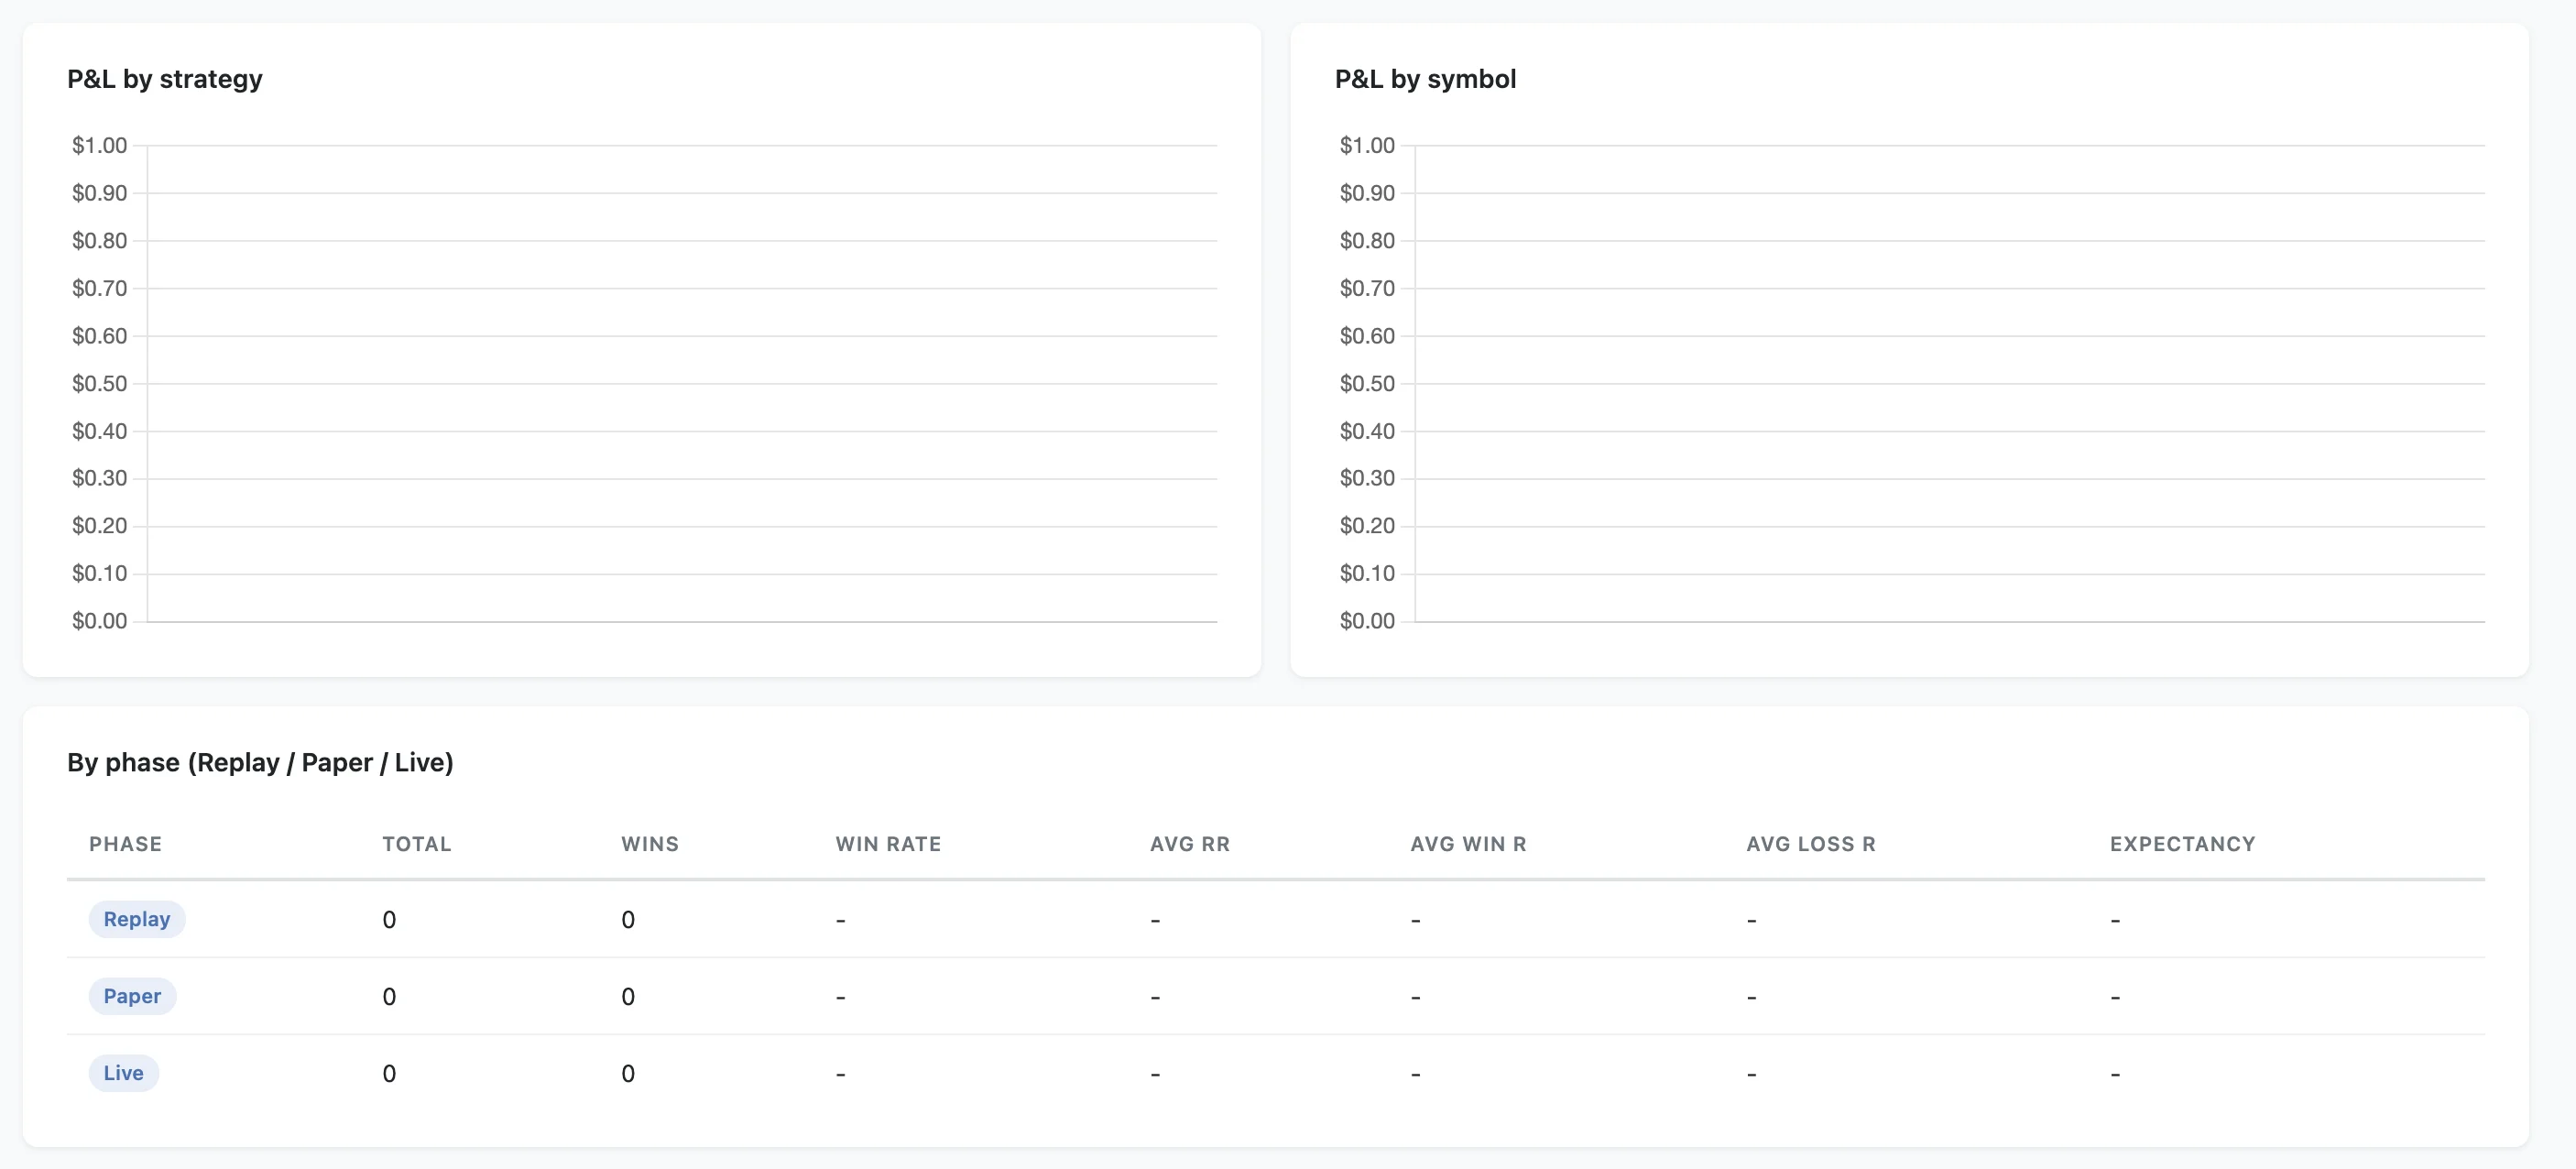
- Visual review: cumulative P&L curve, win/loss breakdown, and P&L by strategy and by symbol
- Live account tracking: automatic balance and profit-above-principal calculation, weekly P&L, and a suggested weekly withdrawal amount based on the percentage you set
- Full trade log: a sortable table of every trade with entry, exit, risk percentage and result
It's a single file that works as soon as you open it, and your data stays with you. Fill in your trades and the blank template becomes your own review center.
A ready-to-use trading journal dashboard that calculates win rate, R multiples and expectancy, tracks weekly P&L with withdrawal suggestions, and helps you review every trade with data.