
PitWall Brief | Race data, laps, tyres, standings
Unofficial tool. Not affiliated with, endorsed by or connected to Formula One, the FIA or any team or driver. Built from public data. Information only: no betting advice and no predictions.
PitWall Brief
A race weekend brief for fans and analysts of top-level open-wheel racing. You send one line. You get one HTML page with the charts already inside, the chart images and CSV files, built from public race data.
What you send
latest race- A Grand Prix by place or name:
Brazil GP,Monza,round 12,Austin 2025 - Two drivers in one race:
Verstappen vs Norris in Singapore - Two drivers across a season:
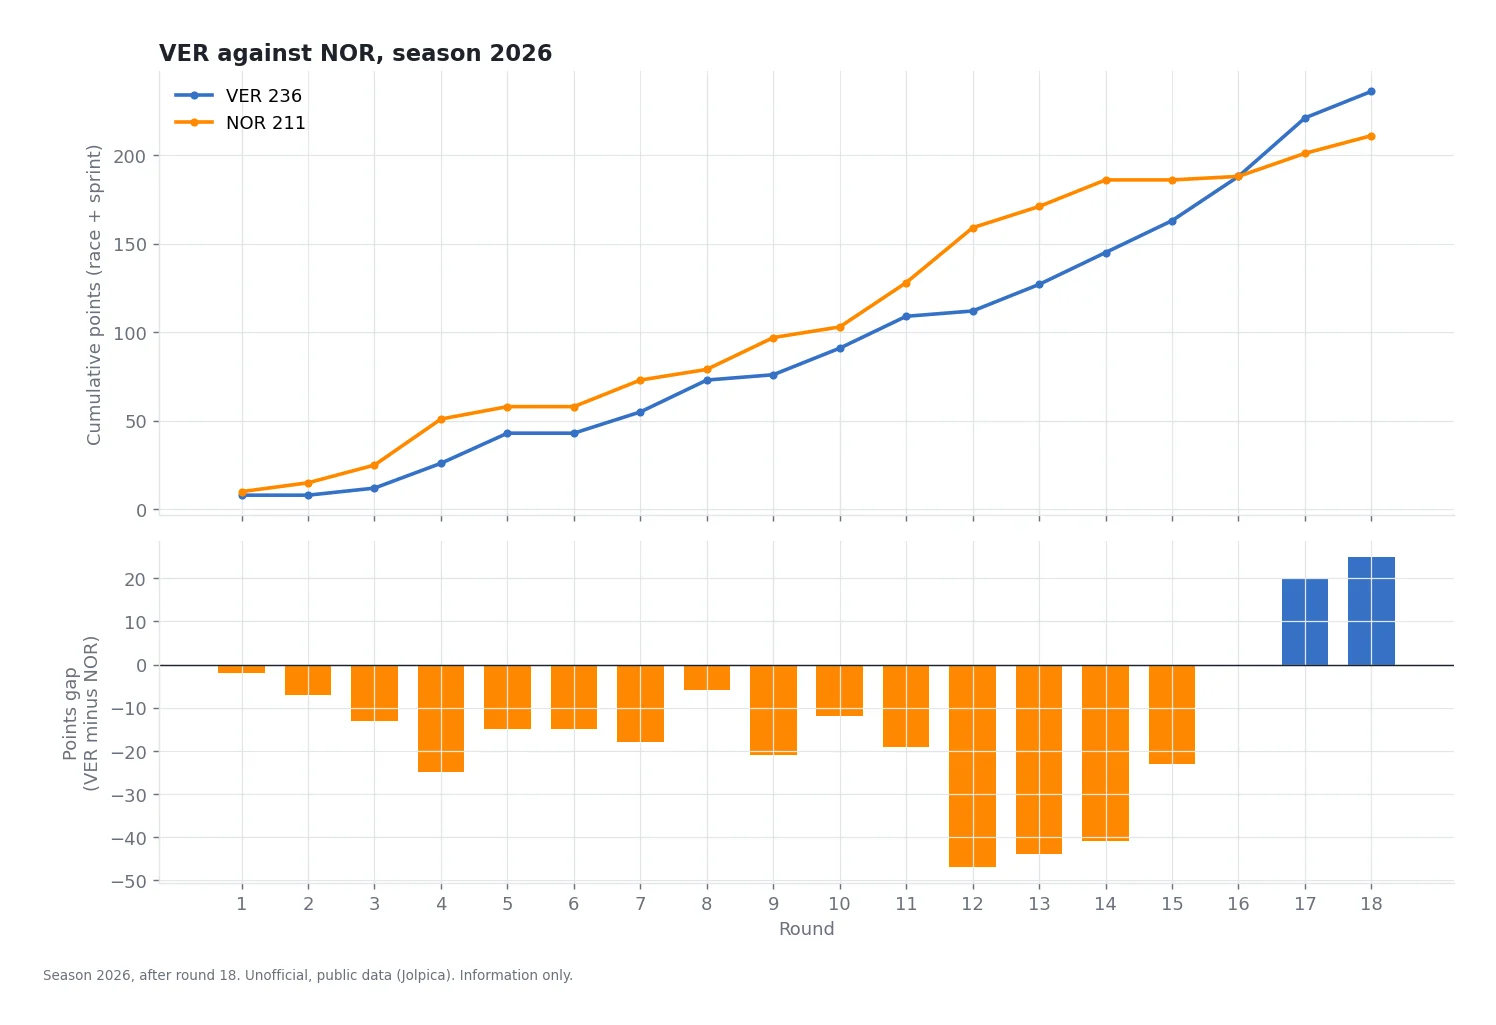
Verstappen vs Norris this season
No password, no email, no login, no file. The data is public.
What you get back
| File | What is in it |
|---|---|
brief.html |
One page, opens offline in any browser, charts embedded: headline, qualifying, result, lap chart, race pace, tyre stints, pit stops, two-driver comparison, championship picture |
charts/*.png |
Every chart as an image, ready for a post or a slide |
results.csv, qualifying.csv |
Classification with grid, places gained, status, points, stops, tyre order, best lap |
laps.csv |
Every lap time and position for every driver |
stints.csv, pit_stops.csv |
Compound, laps, median clean lap and slope per stint; pit-lane time per stop |
standings.csv |
Drivers' standings with points gained this round |
duel_rounds.csv |
Season duel mode: qualifying, finish and points for both drivers in every round |
What is in the brief
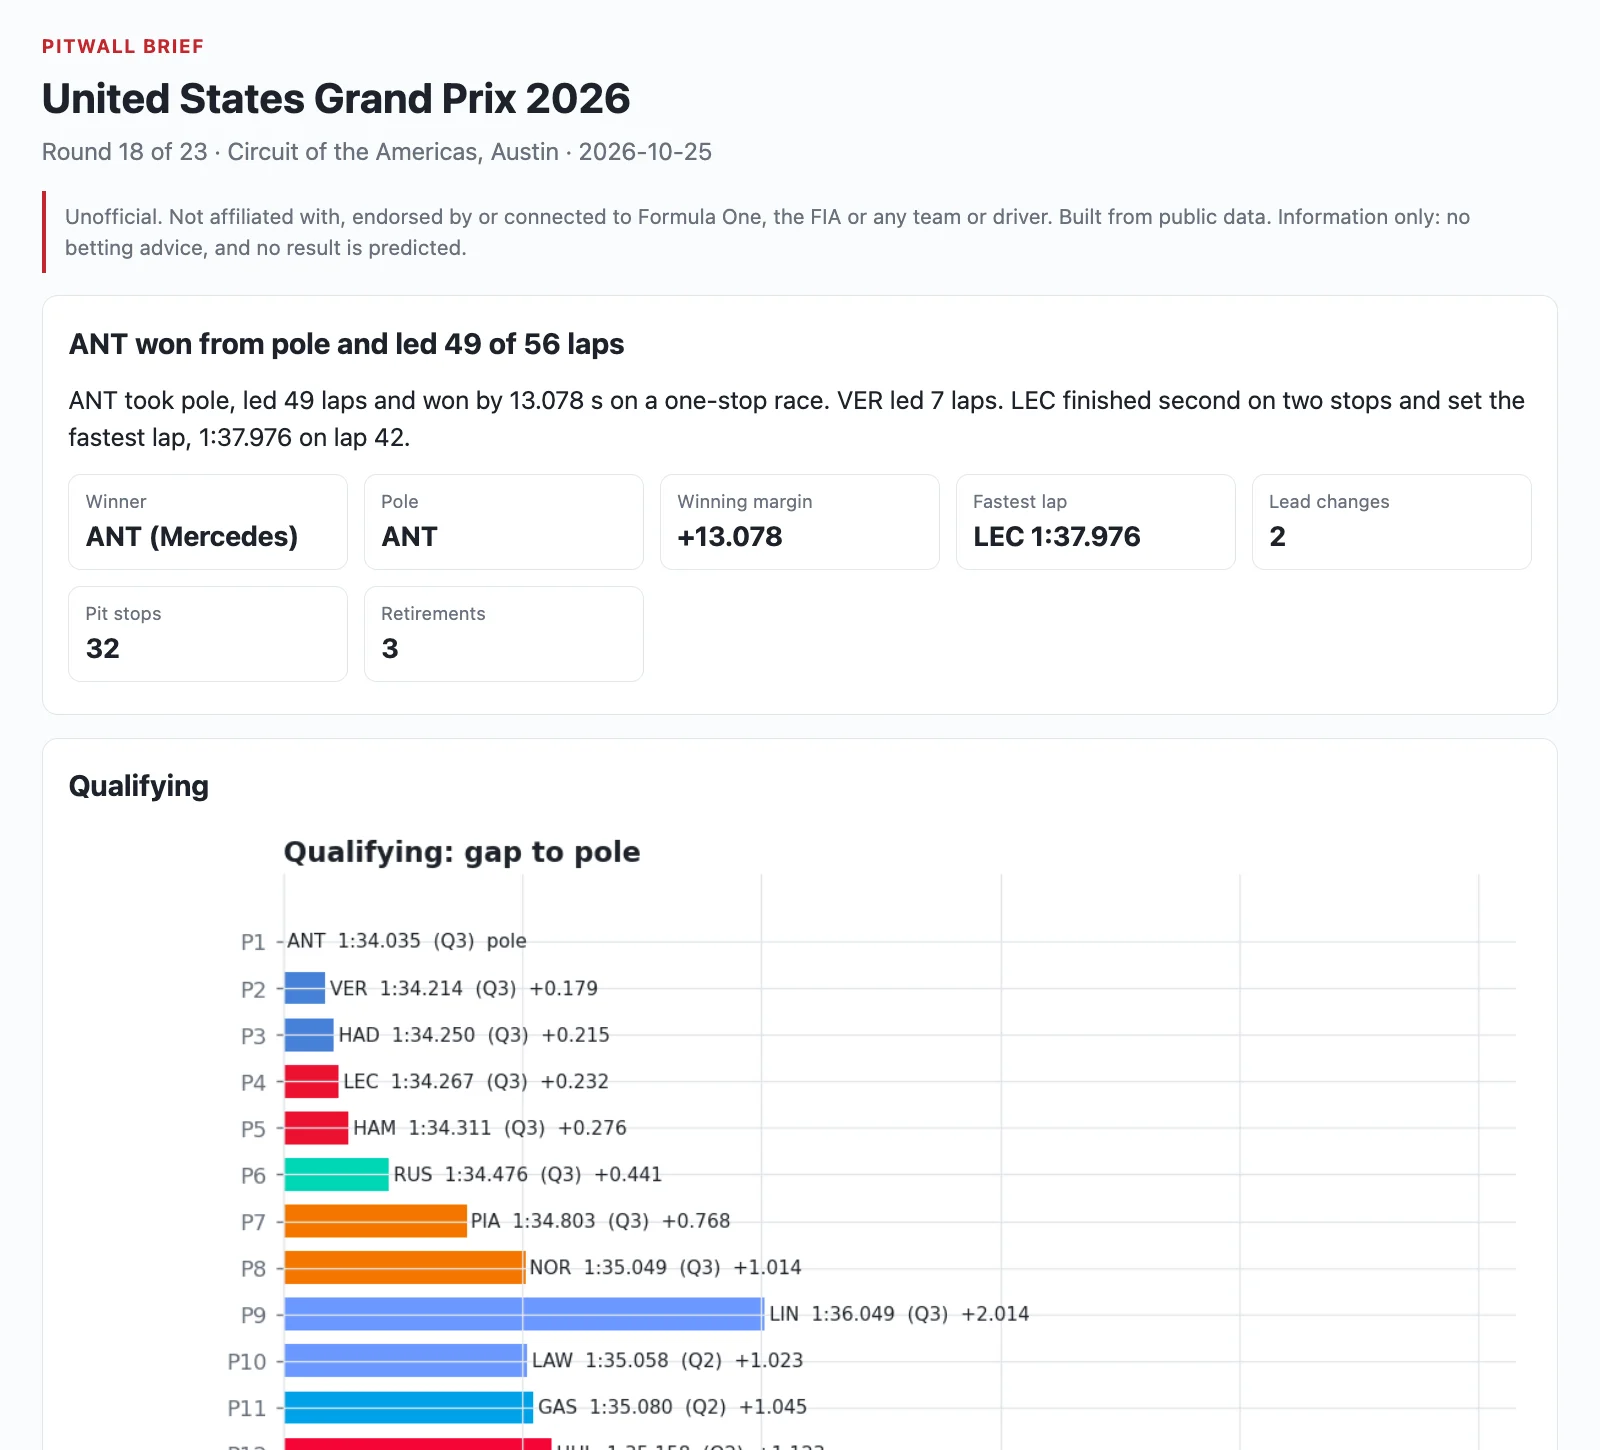
- Qualifying: gap to pole for every driver, with the segment each one reached.
- Result: grid to finish, places gained and lost, points, stops and tyre order.
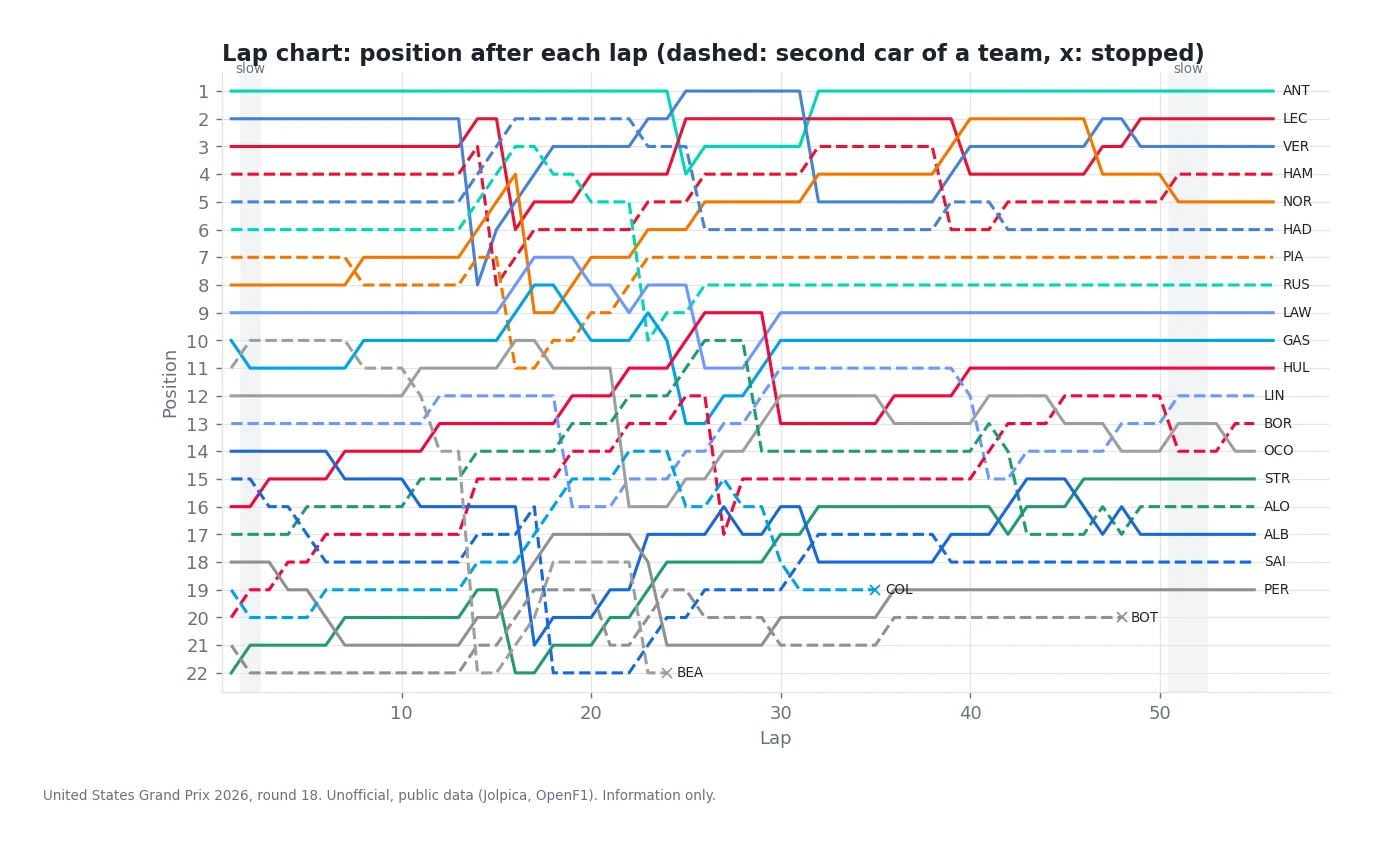
- Lap chart: position after each lap, retirements marked, estimated slow laps shaded.
- Race pace: median clean lap per driver, best lap, lap-to-lap spread, lap-time trend of the leading cars.
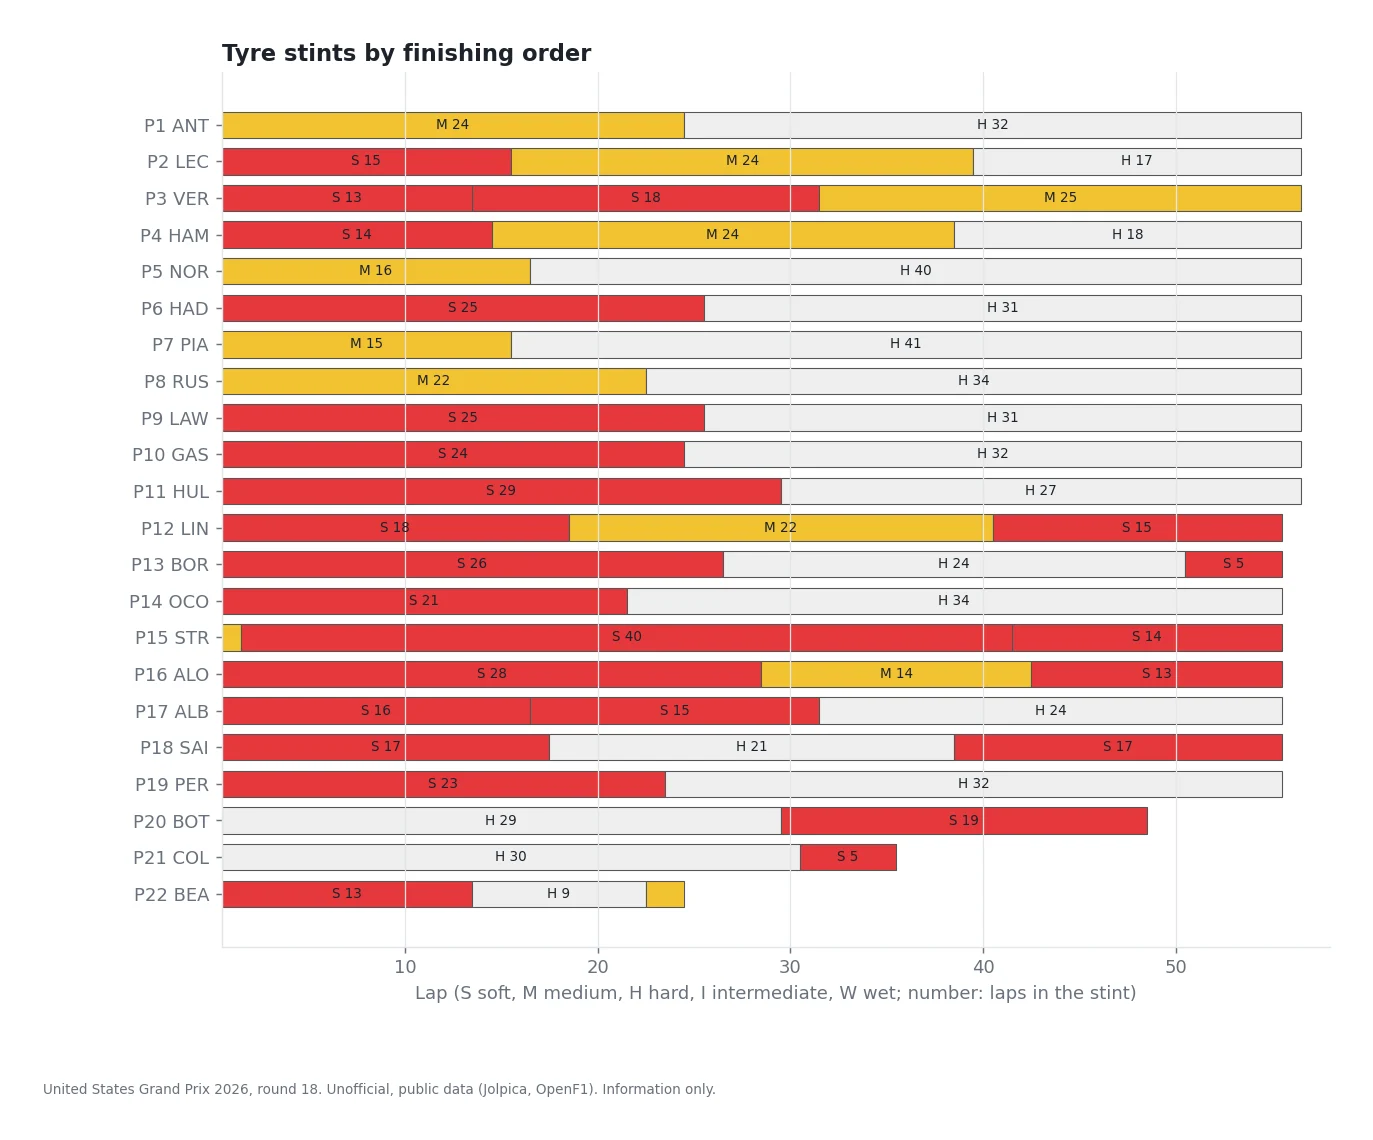
- Tyre stints: compound and length of every stint for every driver, with the median clean lap and raw lap-time slope per stint.
- Pit stops: every stop by pit-lane time, team averages.
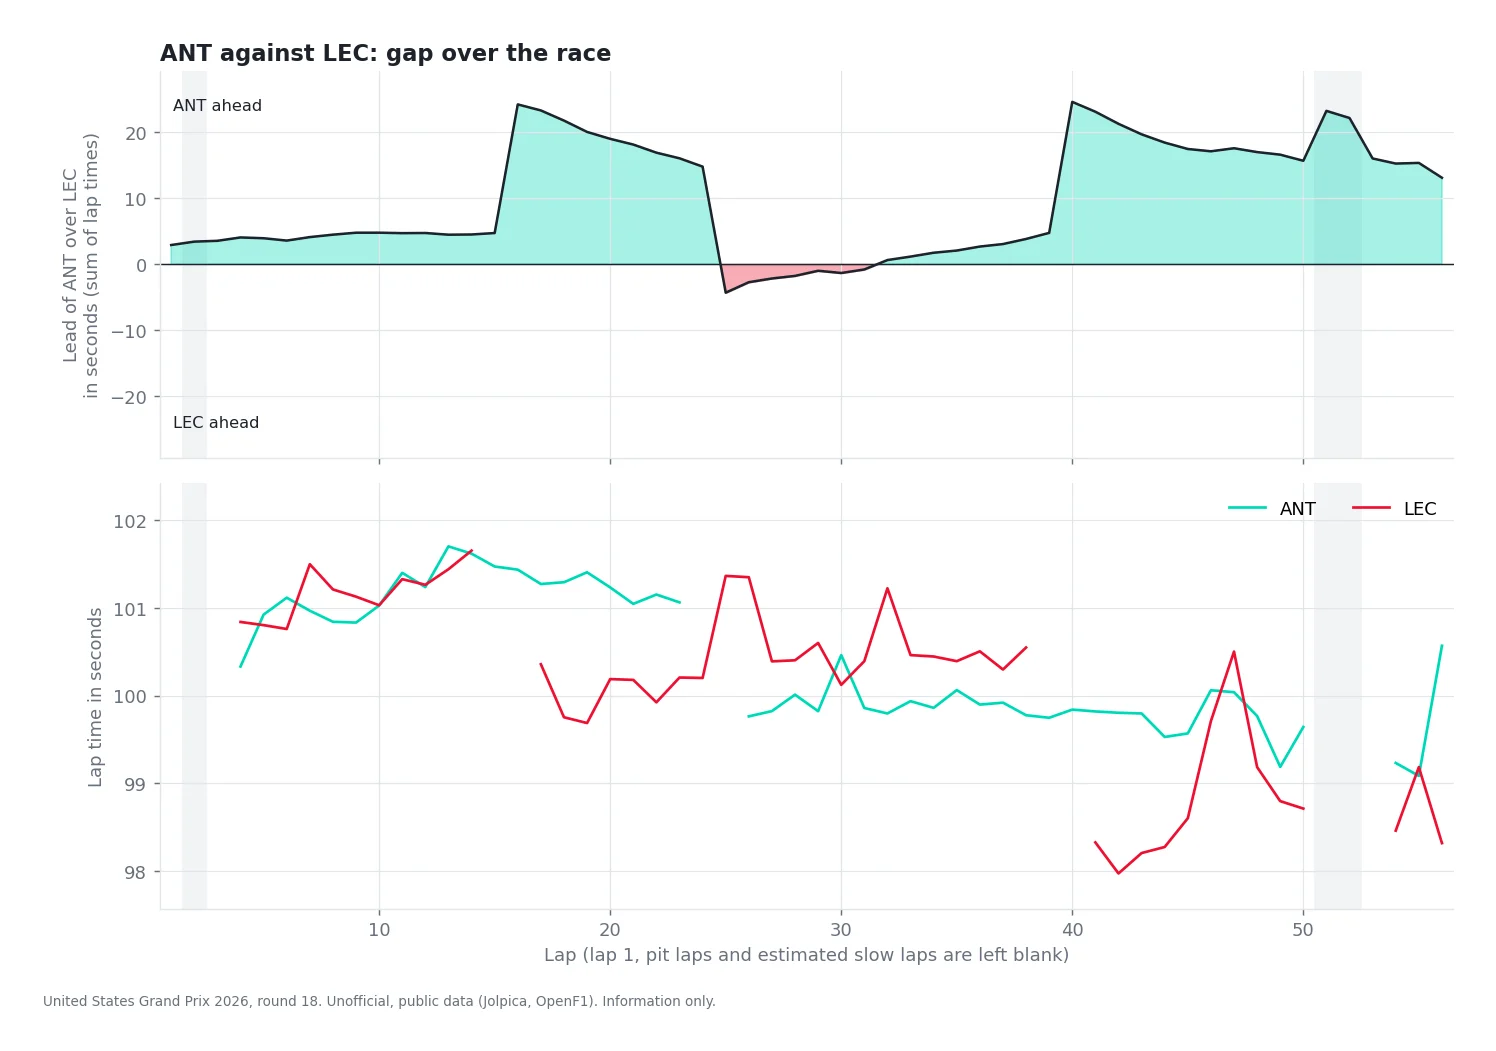
- Two drivers: running gap over the race, laps ahead, median pace, grid, finish, stops.
- Championship: standings after the round, how many points are still available, who can still reach the leader's total on arithmetic alone, and the earliest round the title can be settled if the leader wins everything and the runner-up scores nothing.
- Notes: a few short sentences written from the numbers only. A built-in check flags numbers or driver codes that are not in the data, betting words, predictions and stock phrases.
How the numbers are made
- Qualifying time is the time from the last segment a driver reached.
- Clean laps leave out lap 1, pit in and out laps, estimated slow laps and laps more than 5% slower than the field median for that lap.
- Slow laps are estimated from lap times, not from race control messages.
- Stint slope is the raw lap-time trend inside a stint and includes fuel burn. It is not a pure tyre wear number.
- Pit-lane time is entry to exit of the pit lane, not the stationary time.
- Points arithmetic uses 25 for a win, 18 for second, 8 and 7 for the top two of a sprint and no fastest-lap point.
Time
Measured in a 2-CPU sandbox image on 2026-11-01: a first live run for a 56-lap race reads 23 public API calls in 40 to 60 seconds, the analysis and the eight charts take under 2 seconds. Repeat requests for the same race come from a cache. The assistant then writes its short notes in the same reply.
Requests and limits
Every message you send uses 1 request from your plan. A first brief is one message; a follow-up such as "compare the two Ferraris" is another.
| Plan | Price | Requests |
|---|---|---|
| Weekly | $5.99 | 12 per week |
| Monthly | $14.99 | 50 per month |
| Yearly | $119.99 | 30 per month (360 per year) |
What it does not do
- No live timing, radio, weather, race control messages, penalties or car data. If the data does not show why something happened, the brief does not say why.
- It does not predict results, titles or positions, and it does not give betting advice.
- A weekend still in progress is shown as qualifying only. A race that has not run gives a clear message with its date.
- Results come from a public community-run API. A race that just finished can take minutes to hours to appear, and late corrections can change an order.
- Tyre data comes from a second public source and is sometimes missing. The brief then leaves the tyre section out and says so.
- No logos, team badges, car images or driver photos. Chart colours are plain team colours.
FAQ
Is this official? No. It is an unofficial tool that reads public data.
Which seasons work? The current season and earlier seasons that the public results API covers. Tyre data depends on the second source and is not available for every year.
The race ended an hour ago and it says nothing is published. Try again later. Qualifying usually appears first, race results shortly after.
Can I ask for the previous race, or a driver pair I choose? Yes. Send Spanish GP, Hamilton vs Leclerc or the race before.
Does it give betting tips? No, and it will refuse to. It describes what happened and what the points arithmetic allows.
Unofficial tool. Information only. Not betting advice.
API esterne
api.jolpi.ca/ergast/f1/ · api.openf1.org/v1/ · pypi.org, files.pythonhosted.org