Should've Bought: Stock What-If to Shorts
Please read this first. This skill calculates historical prices and turns them into a video. It is not investment advice or a solicitation to invest, and it does not recommend buying or selling any specific stock. Past returns do not guarantee future results. You alone are responsible for your investment decisions and their outcomes, and the author bears no legal liability for investment losses based on this tool.
"I Should've Bought" — Now Check It With Numbers
The line you hear most in stock communities is "I should've bought back then." The Should've-Bought Calculator runs that "back then" against real historical prices. Instead of showing only the gains, it also shows how far the price fell along the way and what you would have had to sit through.

An actual output video. Samsung, January 2015, ₩1,000,000, compared with the KOSPI. The numbers are a historical record calculated from yfinance adjusted prices.
How to Use It
Just tell the agent.
- "If I'd bought ₩1,000,000 of Samsung in January 2015, what's it worth now? Compare it with the KOSPI."
- "What if I'd put ₩300,000 a month into Nvidia starting in 2019? In KRW, compared with the S&P 500."
- "I hold 10 shares at an ₩80,000 average. How many shares at ₩60,000 do I need to buy to bring my average down to ₩70,000?"
uv run scripts/what_if.py --ticker 005930.KS --name Samsung --start 2015-01 --amount 1000000 --vs ^KS11 --vs-name KOSPI
uv run scripts/gguel_shorts.py out/result.json -o samsung.mp4 --sound
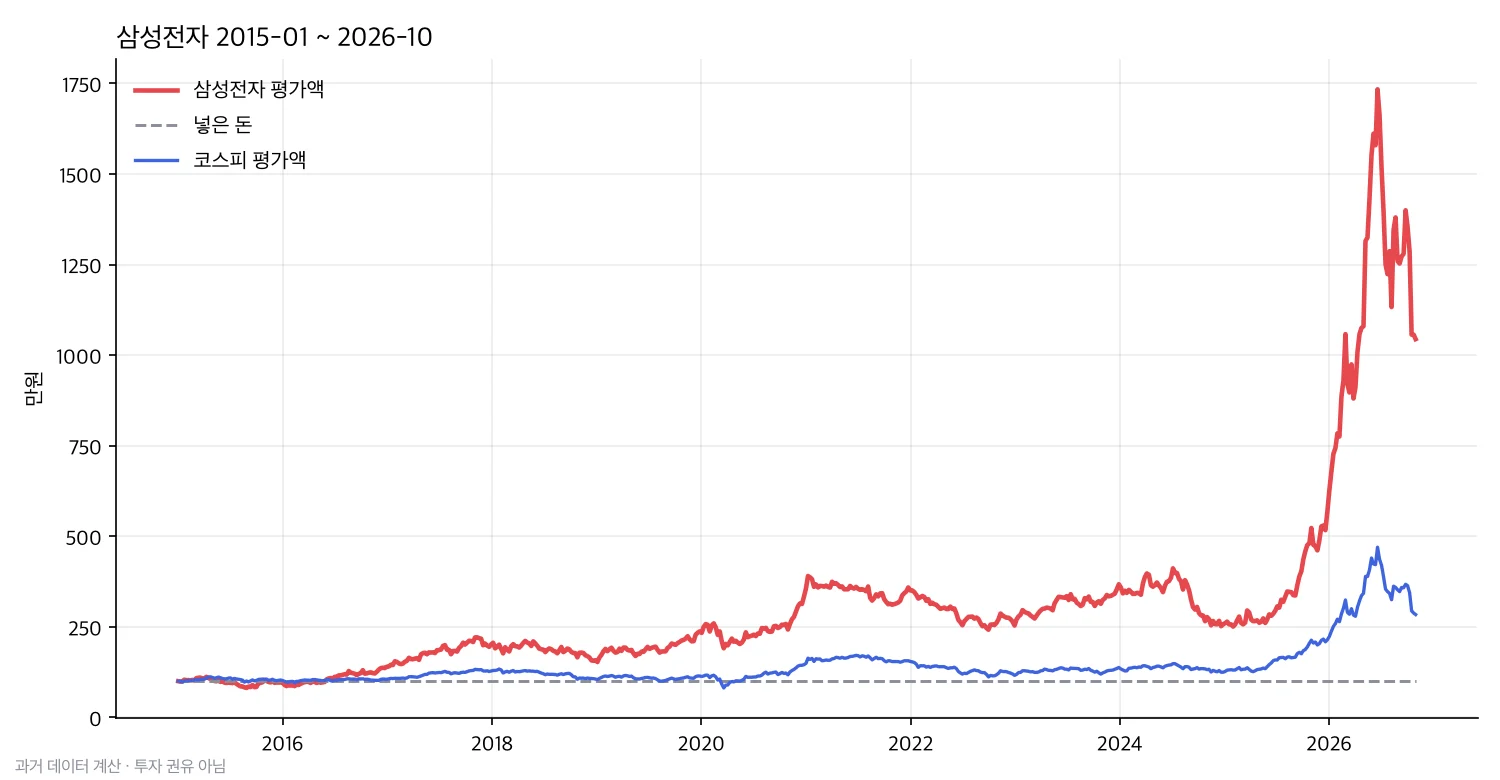
The chart that goes into report.md. It plots market value, money invested, and the comparison index on a single page.
What It Calculates
| Item | Details |
|---|---|
| Lump sum / recurring | Once at the start, the first trading day of each month, or a mix of both |
| Convert to KRW | Foreign stocks are bought at that day's exchange rate and valued at today's rate |
| Comparison | The same money put into the KOSPI, S&P 500, Nasdaq, and so on |
| Returns | Market value, total return, annualized return (XIRR for recurring contributions) |
| The stretch you ride out | The stock's maximum drawdown and how long it lasted, the day it recovered, and the point where your own market value shrank the most |
| Averaging down / up | New average, cash needed, and the gain required to break even, given a target average, budget, or share count |
Short Video
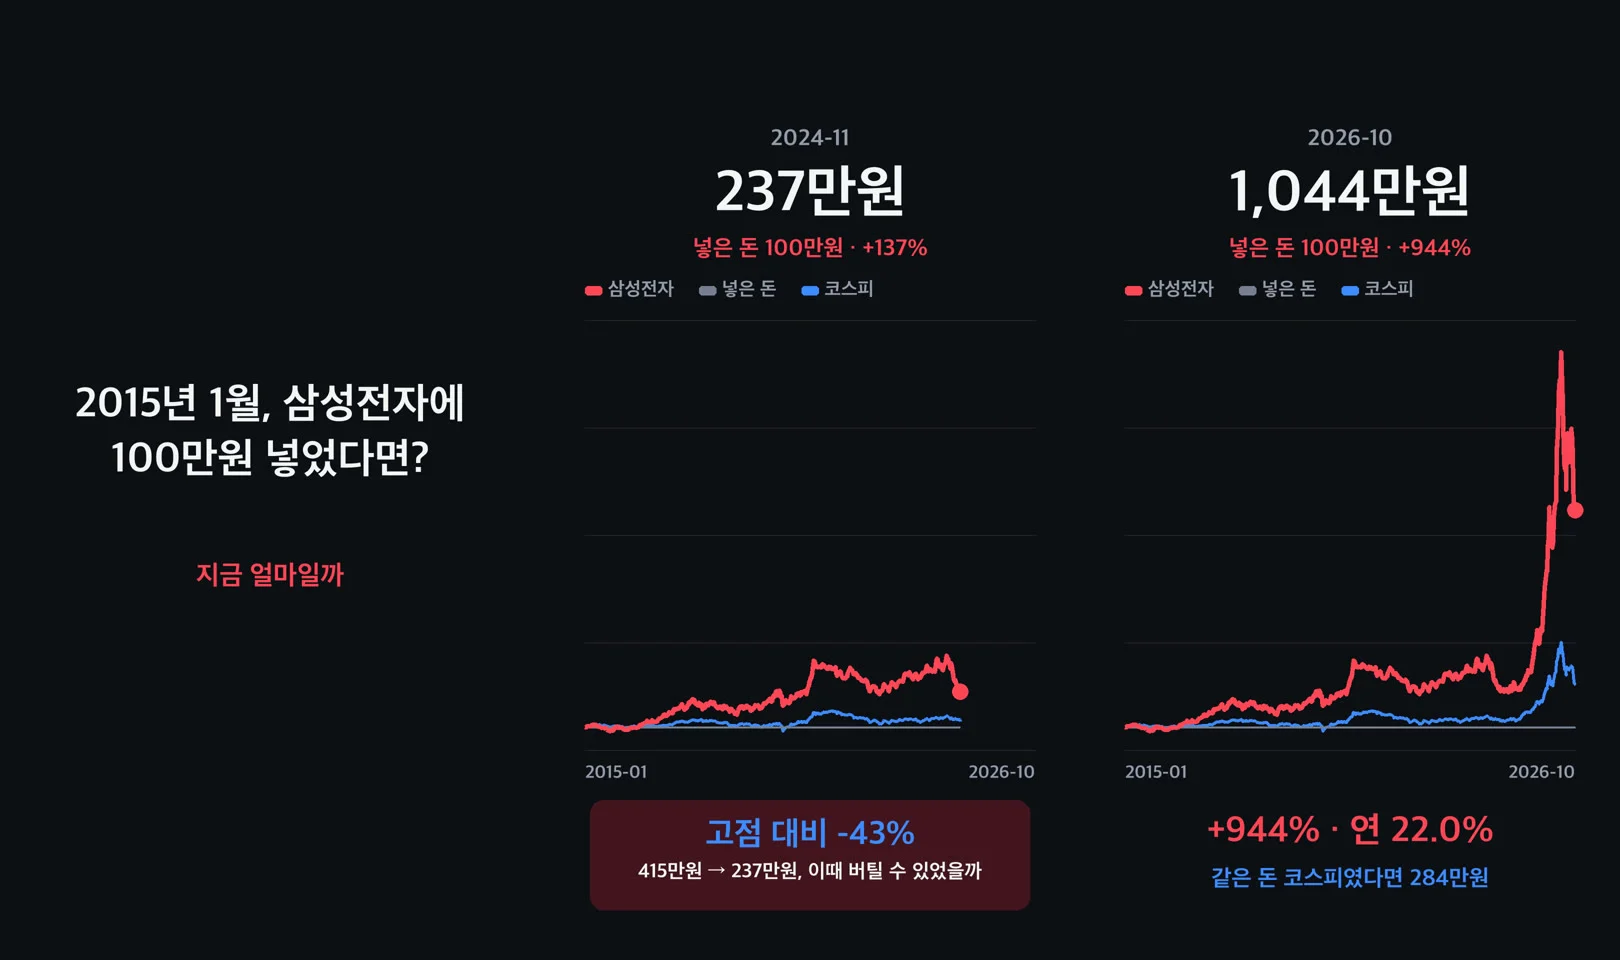
Question → the chart draws in as the amount climbs → it pauses at the deepest drop → result. A disclaimer line is added automatically on the final screen.
- 1080x1920, about 16 seconds, sound effects synthesized in-house (no copyright worries), no watermark
- You can change the opening line, and it includes a guide to series ideas like "₩1,000,000 ten years ago" or "₩300,000 on payday"
What's Inside
| File | Contents |
|---|---|
SKILL.md |
The calculate → report → video workflow and the rules the agent follows |
scripts/what_if.py |
Historical results calculator (report, chart, JSON) |
scripts/gguel_shorts.py |
Shorts renderer (Pillow + ffmpeg) |
scripts/avg_down.py |
Averaging-down / up calculator (standard library only) |
guides/ideas.md |
Shorts series ideas and phrasing to avoid |
DISCLAIMER.md |
Notice to read before use |
What This Skill Does Not Do
- Stock recommendations, buy/sell timing, price targets, or price predictions. Even if you ask the agent, its rules keep it from making the call for you — it only shows the calculation.
- Account for taxes, fees, or currency-exchange fees. Real results come out lower.
- Real-time quotes or automated trading.
Requirements
uv,ffmpeg(free to install), and an internet connection. Prices come from yfinance's free data, so no API key is needed. Because the data is unofficial, it can be wrong or incomplete.
FAQ
Q. Does it work for Korean stocks? Yes. It uses KOSPI .KS and KOSDAQ .KQ tickers. Just say the stock name and the agent will look up the ticker and confirm it with you.
Q. Are dividends included? It calculates with adjusted prices that reflect dividends and splits (close to reinvesting dividends). Dividend income tax is not included.
Q. Can I post the video on my channel? Yes. Just don't use it to push a specific stock or to promote a paid recommendation service. We recommend leaving the disclaimer screen in place.
Q. Does it work on Windows? Yes.
Disclaimer This skill and its output are informational historical-data calculations, not investment advice or solicitation. The accuracy of the data is not guaranteed. You alone bear full responsibility for your investment decisions and their outcomes, and to the extent permitted by applicable law the author bears no legal liability for investment losses based on this.
外部API
yfinance