Visual Explainer - Online Skill
Visual Explainer, now runnable online
What it does
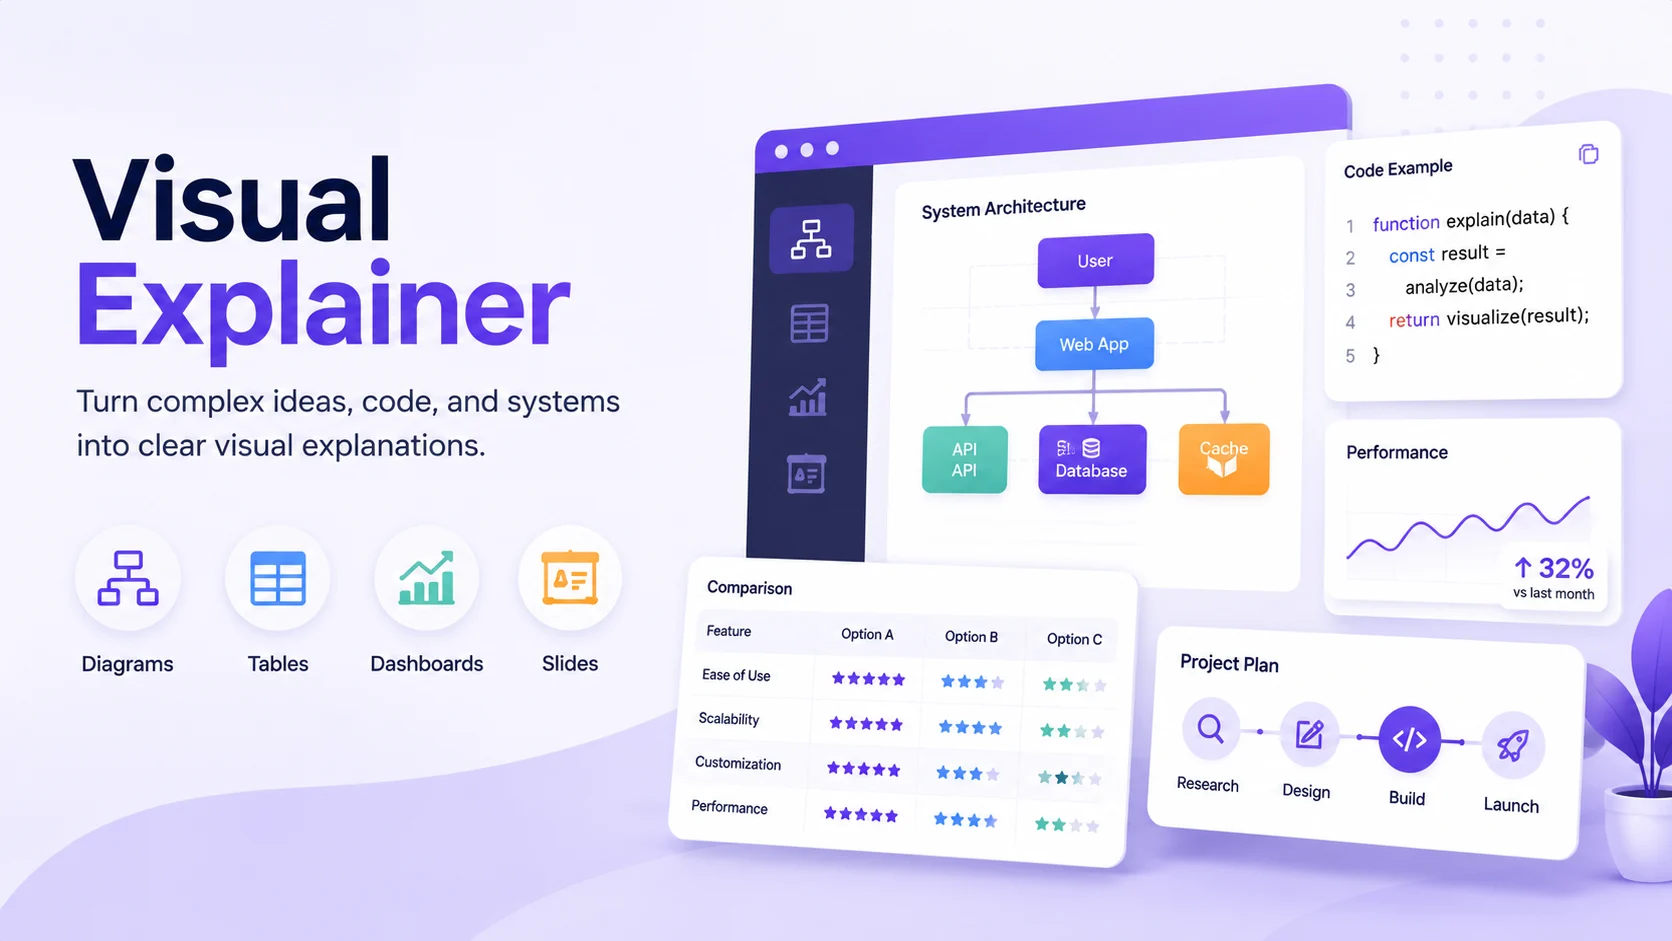
Coding agents default to ASCII art and pipe-and-dash tables when you ask for a diagram or a comparison. Anything past a three-box flowchart turns into an unreadable mess. Visual Explainer fixes that. It generates a self-contained HTML page with real typography, dark and light themes, interactive Mermaid diagrams you can zoom and pan, and Chart.js dashboards. It picks the right format on its own: Mermaid for flowcharts, CSS grid cards for architecture, HTML tables for data, charts for numbers.
What you can ask for
- Diagram a system or flow: "Draw a diagram of our authentication flow."
- Review a diff: paste a diff or describe the change and get a visual architecture comparison.
- Audit a plan: compare an implementation plan against the code with a risk assessment.
- Project recap: a mental-model snapshot to pick a project back up.
- Fact-check a doc against the actual code.
- Comparison tables: drop 15 requirements and get a clean sortable table instead of a wall of pipes.
- Slide decks: add "as slides" to most of the above for a magazine-quality deck.
How to use it
Say what you want in plain language, or paste the material (code, a diff, a plan, a dataset, notes). The agent decides whether a diagram, a table, a dashboard, or a slide deck fits best, then returns a complete HTML page you can open, save, or share. The more context you give (the actual code, the real numbers, the constraints), the sharper the result.
Example
Input: "Compare these 15 requirements against our refactor plan and flag the risks."
Output: a structured HTML page with a requirements table, a coverage view, and a risk callout, ready to open in your browser.
Good to know
It shines on technical content: architecture, diffs, plans, data, and recaps. Output is a single portable HTML file with no build step and no dependencies beyond a browser.
Created by nicobailon.
Original open-source project: https://github.com/nicobailon/visual-explainer/ (8.6k+ GitHub stars, MIT licensed).
This agent runs that skill online, so there is nothing to install. You describe what you want explained, and you get a finished HTML page back.