

Stock Analysis-Markets, Crypto & Macro
Context: The NVIDIA report excerpts below were generated on May 25, 2026, based on NVIDIA's May 22, 2026 close and the market conditions available at that time.
Disclaimer: Market Vector Force content is provided for general informational and research purposes only and does not constitute investment, securities, legal, or tax advice, or a recommendation or solicitation to buy, sell, or hold any financial asset. Market data, news, and analysis may be delayed, incomplete, or inaccurate; past performance and scenario projections do not guarantee future results. Verify information independently and consult a qualified professional before making investment decisions.
Diagnose the Risk Stack Behind a Market Move
Ask about a stock, index, sector, crypto asset, or macro market. Market Vector Force does not stop at a news roundup: it converts evidence into ranked forces, assigns intensity and time horizon, and shows what could change the thesis.
For NVIDIA, the report surfaces structural downside forces such as China data center exclusion, persistent inflation, and export-policy risk, then identifies which risks matter beyond the current price move.
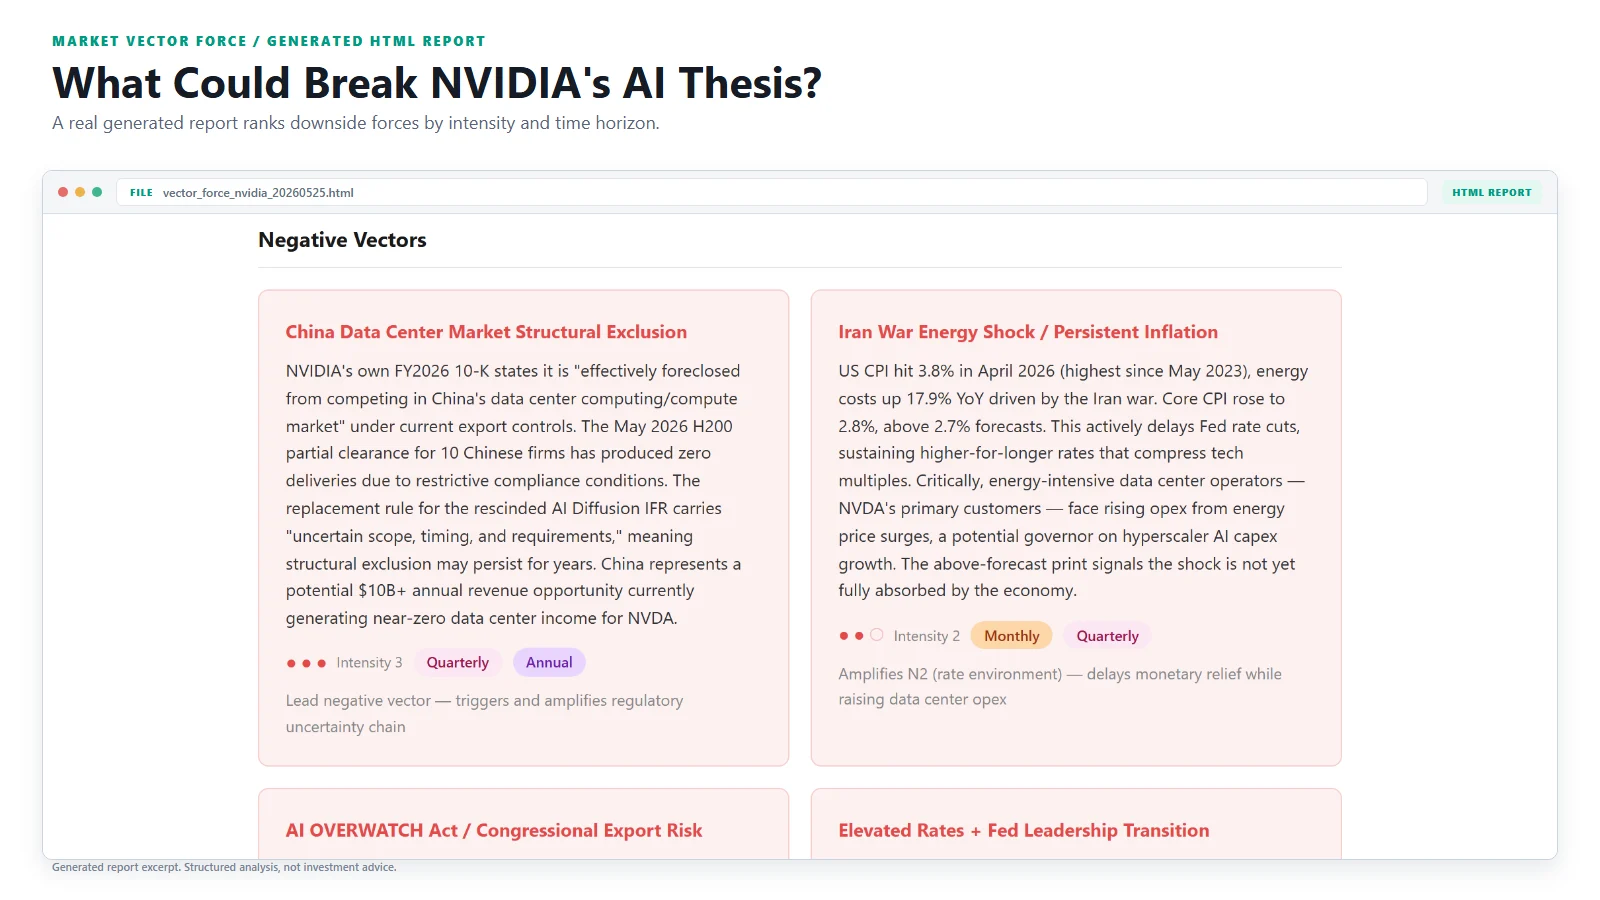
Excerpt from a generated NVIDIA downside report.
Compare What Still Supports the Thesis
The report does not turn risk identification into a one-sided verdict. It also maps the forces supporting upside: earnings acceleration, forward guidance, structural moat, capital returns, momentum, or policy optionality.
For NVIDIA, record Q1 results, $91B Q2 guidance, CUDA's ecosystem moat, and capital returns can be evaluated against the same risk stack, using the same scoring and horizon framework.
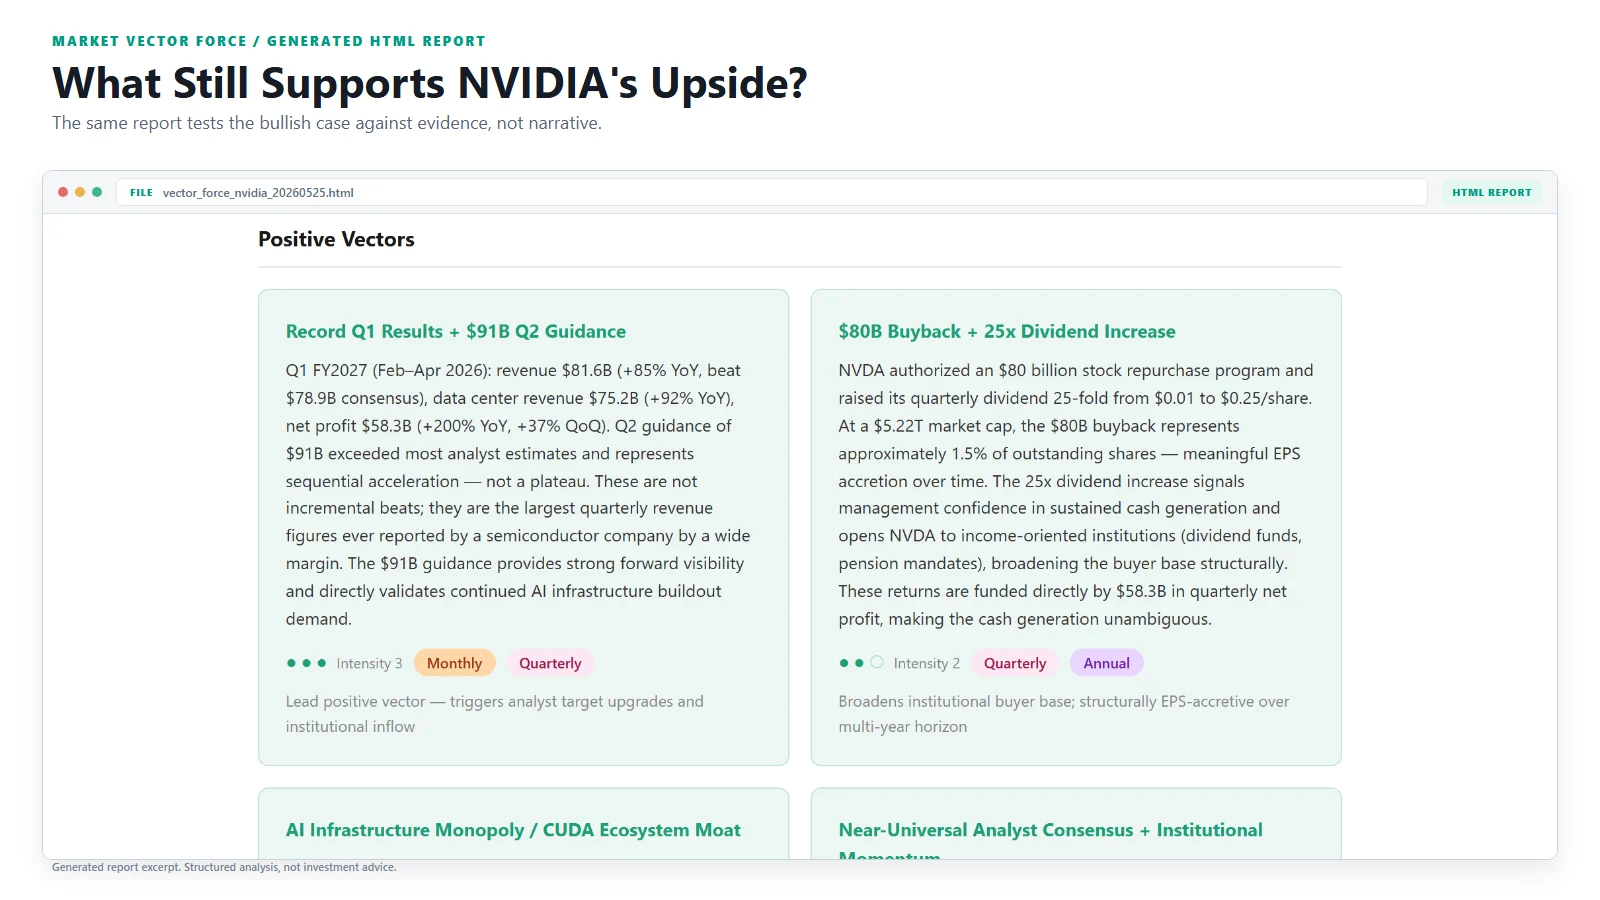
Excerpt from the same report's upside analysis.
Turn Competing Forces into a Market Verdict
Vector cards are only the inputs. The output is a self-contained HTML report that converts competing pressures into a net view by time horizon, causal chains, key inflection points, and scenario projections.
The NASDAQ 100 example shows why this matters: AI and NVIDIA earnings can support a strong near-term uptrend while inflation, rates, trade pressure, and supply constraints produce annual headwinds.
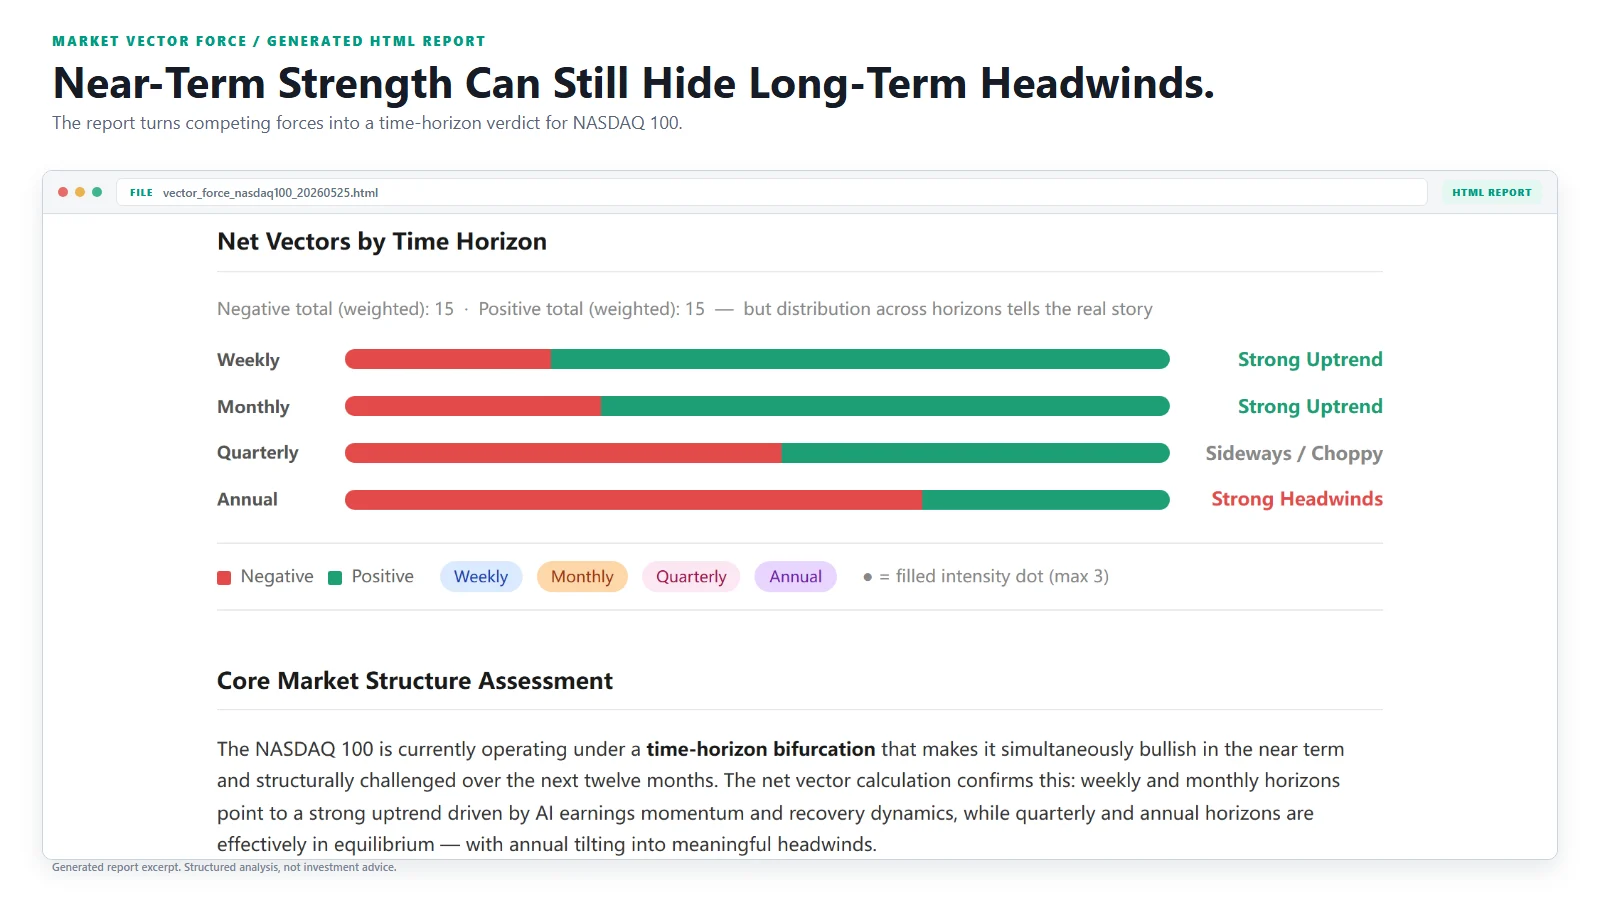
Excerpt from a generated NASDAQ 100 time-horizon verdict.
Open the report locally, share it, or export it to PDF. The result is structured analysis designed for understanding market pressure, not a trading instruction.
Example Questions
- "Why is NASDAQ falling? Is this a dip or something bigger?"
- "Break down the forces on Bitcoin right now."
- "What is driving Tesla before earnings?"
- "Analyze the semiconductor sector's bullish and bearish forces."
- "Help me understand what is moving A-shares this week."
- "What are the key inflection points for oil prices?"
Any language. Any market. The output is structured analysis, not investment advice.


