Portfolio Checkup — Your Hidden ETF Overlap
Read this first. This skill is a diagnostic tool that uses past prices to show your portfolio's concentration and risk structure. It is not investment advice or a solicitation, and it does not recommend what to buy or sell or how much to weight. Past volatility and drawdowns do not guarantee future results. You are responsible for your own investment decisions and their outcomes.
Is six holdings really diversified?
Hold QQQ, VOO, NVIDIA, and Apple together and you own four names, but NVIDIA and Apple are also sitting inside those ETFs. Portfolio Checkup opens the ETFs up and shows you, in numbers, what you actually hold and how much, and who's really driving the swings in your account.

Demo built from real output. This is an example portfolio, not a recommendation.
How it works
Just tell the agent your holdings and share counts.
QQQ | 15 | QQQ
NVDA | 40 | NVIDIA
005930.KS | 50 | Samsung Electronics
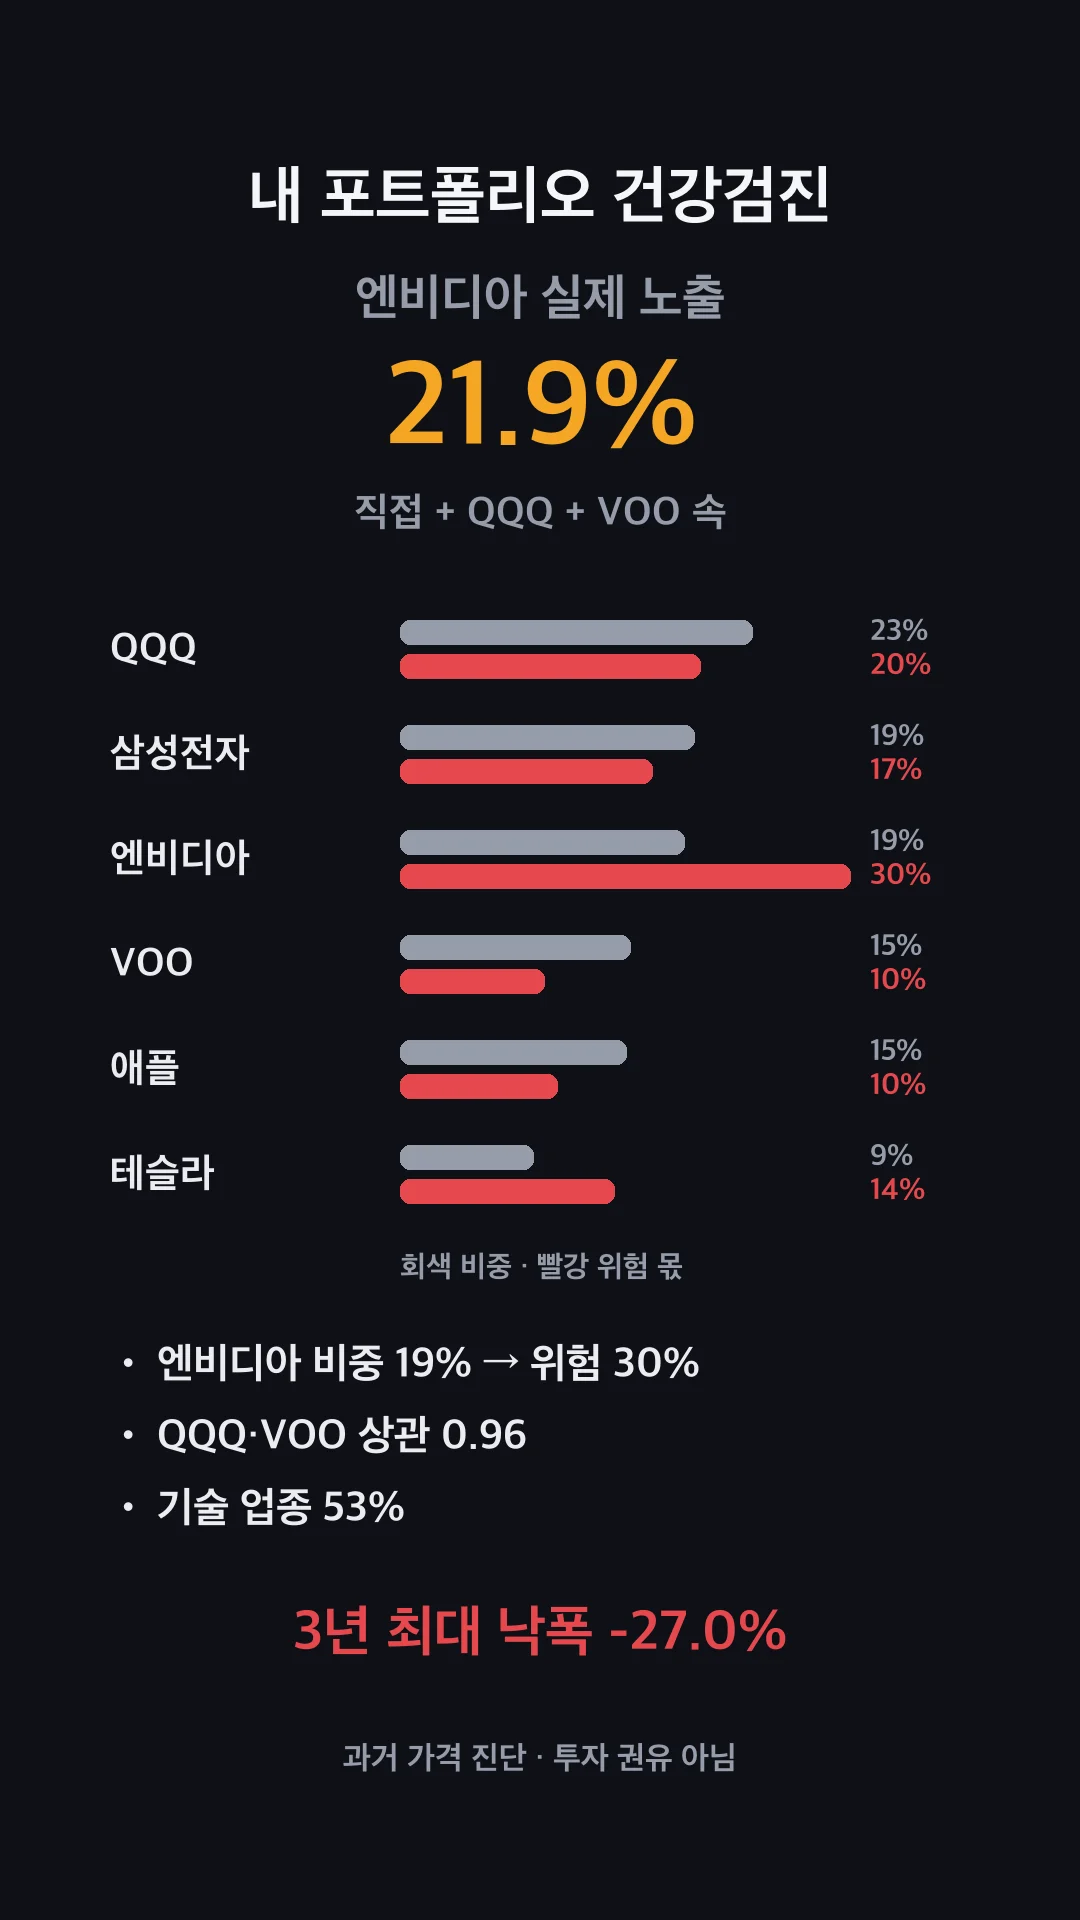
Example: you hold NVIDIA at 19% directly, but add its slice inside QQQ and VOO and real exposure is 21.9%. A 19% weight, but a 30% risk share.
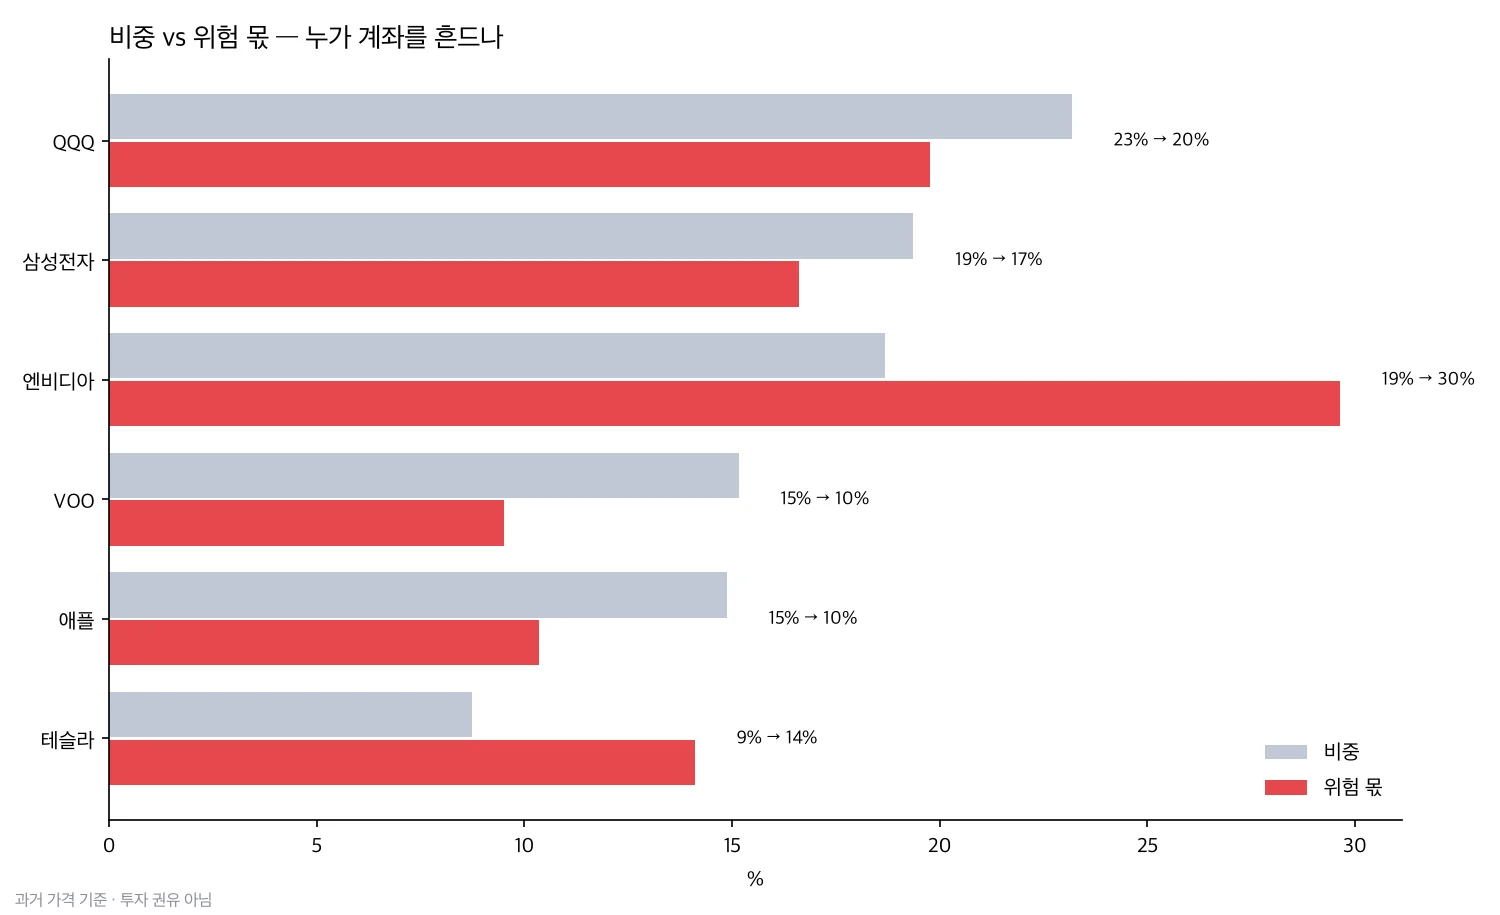
Gray is weight; red is the share of your account's daily swing that holding creates. When red runs much longer, that holding is driving the swings.
What it diagnoses
| Item | What it shows |
|---|---|
| Risk share | Each holding's weight vs. its contribution to portfolio volatility |
| Hidden overlap | Real exposure after expanding each ETF's top holdings and adding them to your direct positions |
| Correlation | A heatmap of how closely your holdings move together |
| Concentration | Sector and currency weights, and the effective number of holdings |
| Max drawdown | The largest peak-to-trough drop if you'd held today's share counts over the past 3 years |
What's included
| File | What it is |
|---|---|
SKILL.md |
The procedure and the rules the agent follows (no prescriptions, no recommendations) |
scripts/pf_checkup.py |
The diagnostic engine (report, three graphs, card, JSON) |
examples/holdings.txt |
Example input |
DISCLAIMER.md |
Notice to read before use |
What this skill won't do
- Pick which holdings to cut when you ask "so what should I trim?" A high risk share isn't bad, it's just a fact.
- Reflect an ETF's full composition. It expands only the top 10 holdings from the free data, so overlap can read lower than it really is.
Requirements
uvand an internet connection. It runs on free yfinance data, so no API key is needed.
Want it without installing anything? Look up "Stock Account Assistant" on Capafy, a subscription agent that runs this and seven other tools right from chat.
Disclaimer This skill and its output are informational calculations based on historical data, not investment advice or a solicitation. Accuracy of the data is not guaranteed. You are solely responsible for your investment decisions and their outcomes, and to the extent permitted by applicable law the author accepts no legal liability for investment losses based on them.
Externe API’s
yfinance