

Smart Money Radar
Smart Money Radar
What did Buffett buy last quarter? Which stocks are three top funds piling into at the same time? Is a CEO buying their own stock, or quietly selling?
The answers are public, but they're buried in thousands of SEC filings full of tax paperwork, pre-scheduled sales and filer mistakes. Smart Money Radar reads those filings for you, strips out the noise and shows what's left: real conviction moves by people with real money on the line. Every number links back to the original filing.
What is does
1. Every tracked fund's move for your watchlist
2. Follow the most-watched funds
Berkshire Hathaway, Pershing Square, Duquesne, Appaloosa, Third Point, Tiger Global, Coatue, ARK, Baillie Gifford, Bridgewater, Citadel, Renaissance and more.
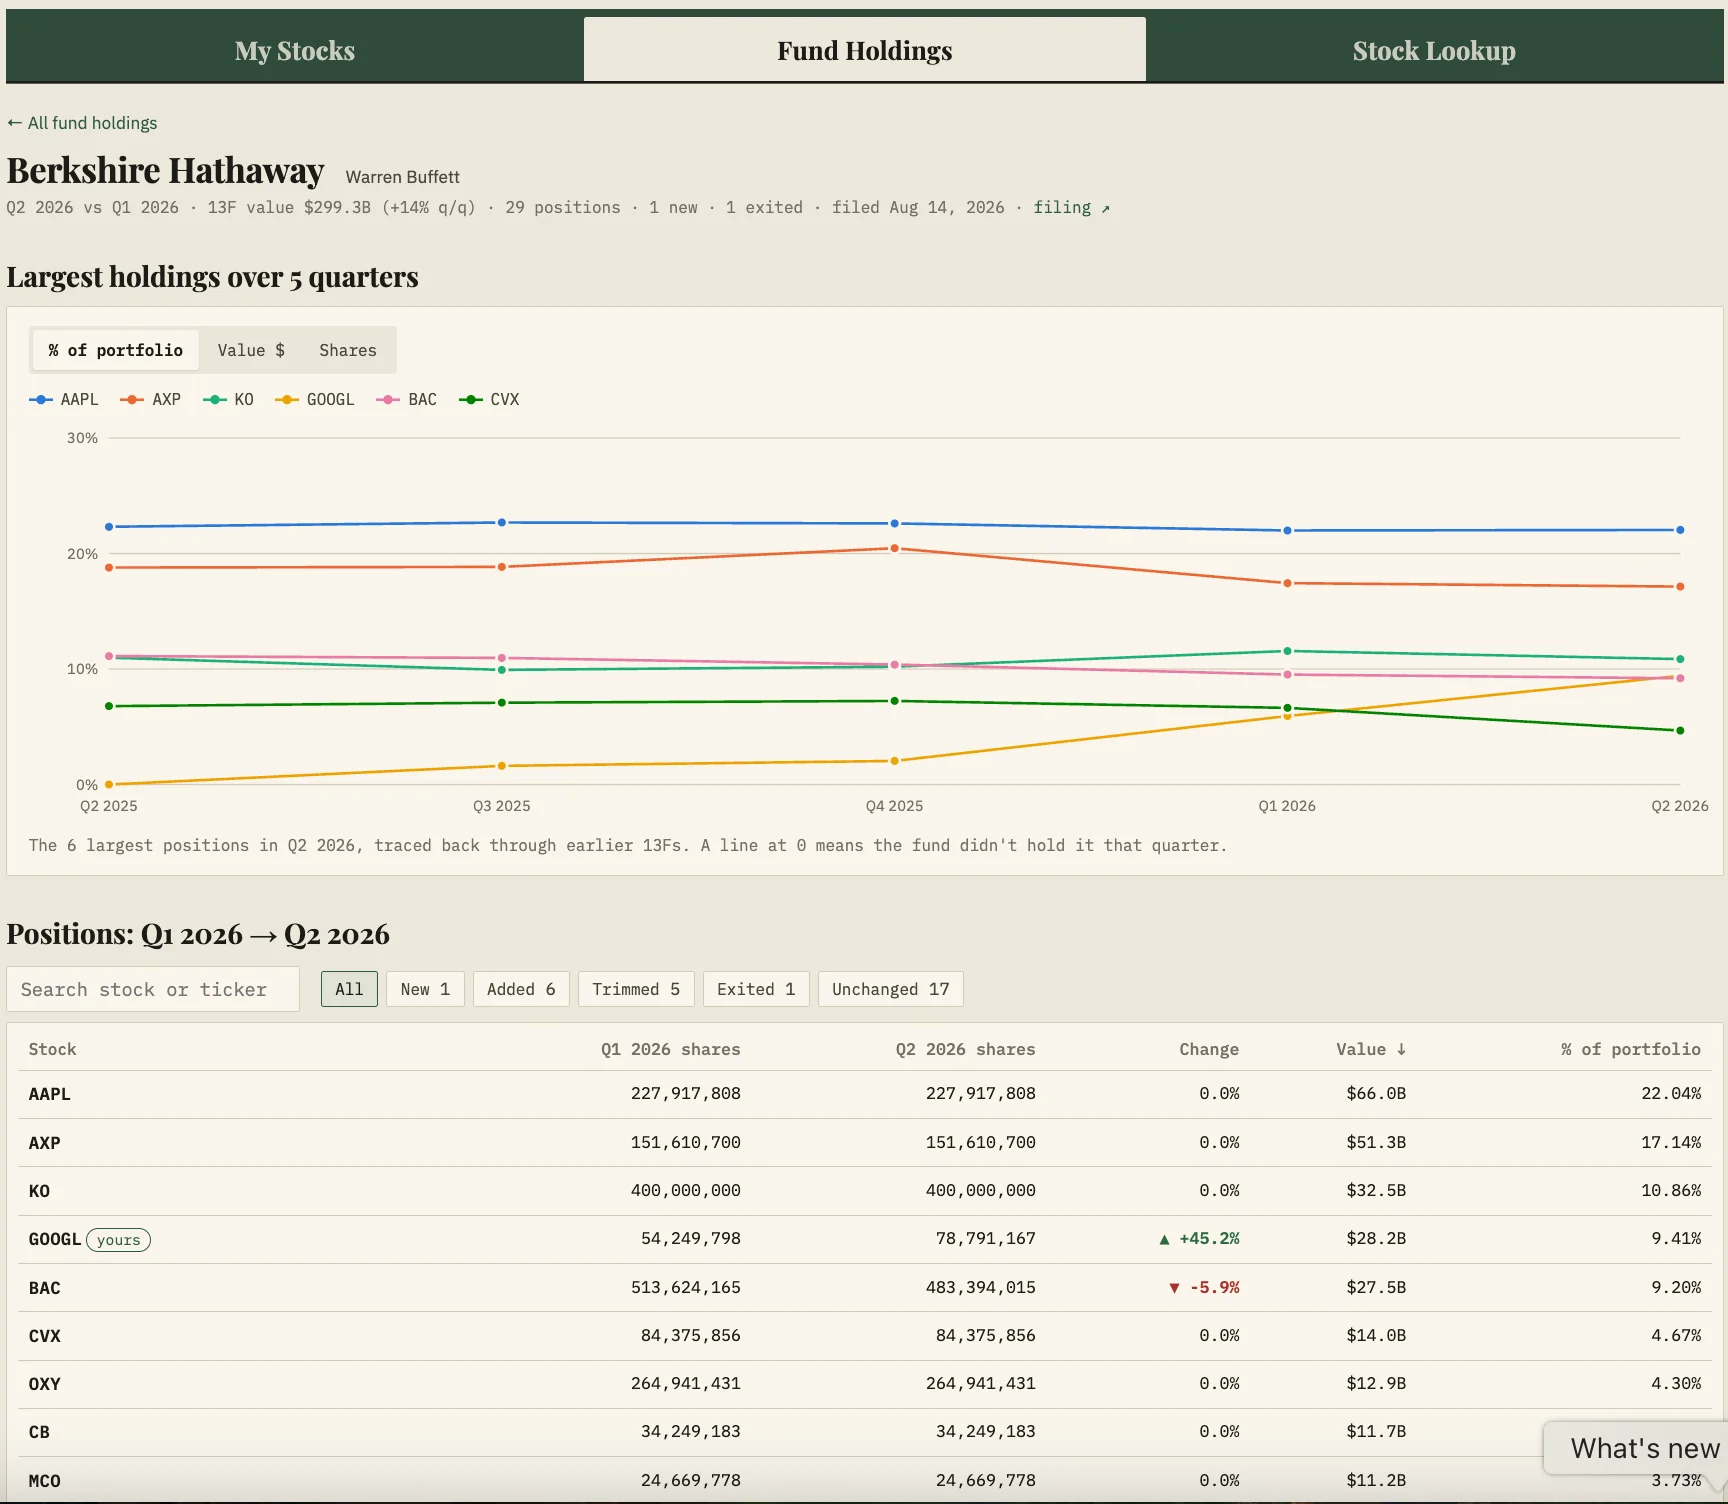
- Every position, side by side: last quarter's 13F against this quarter's, with each change marked ▲ or ▼ and new buys and full exits tagged
- Five quarters on one chart: a fund's biggest holdings over time, as % of the portfolio, dollar value or share count
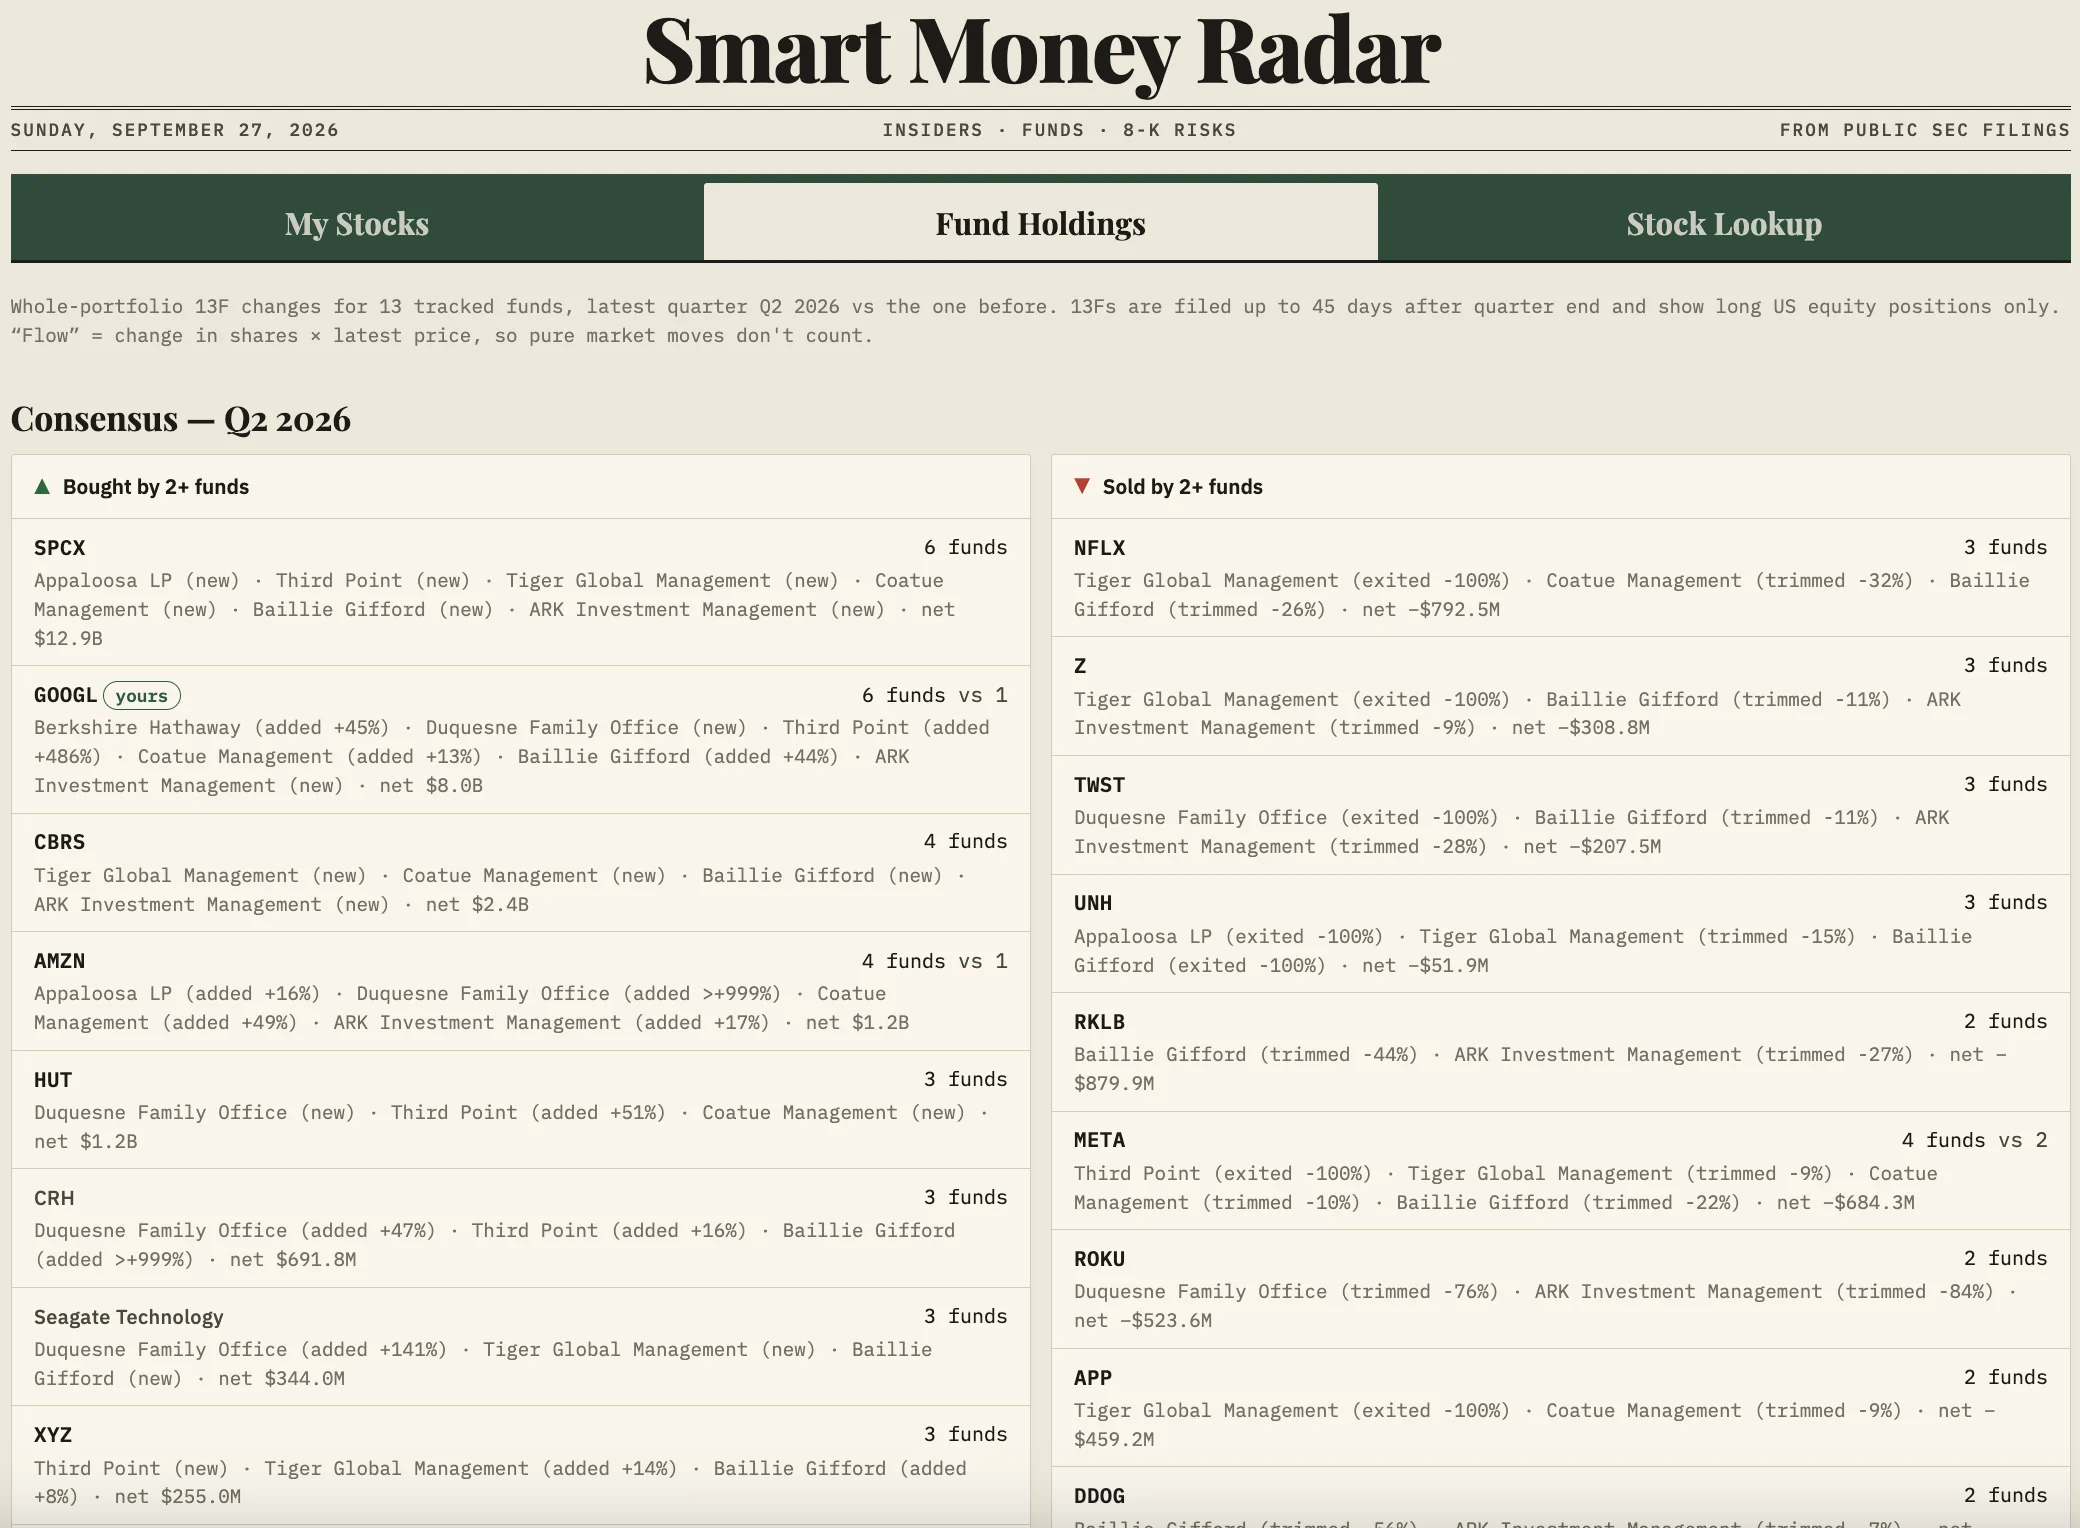
- Consensus: the stocks two or more funds bought, or sold, in the same quarter
Consensus
Fund position table
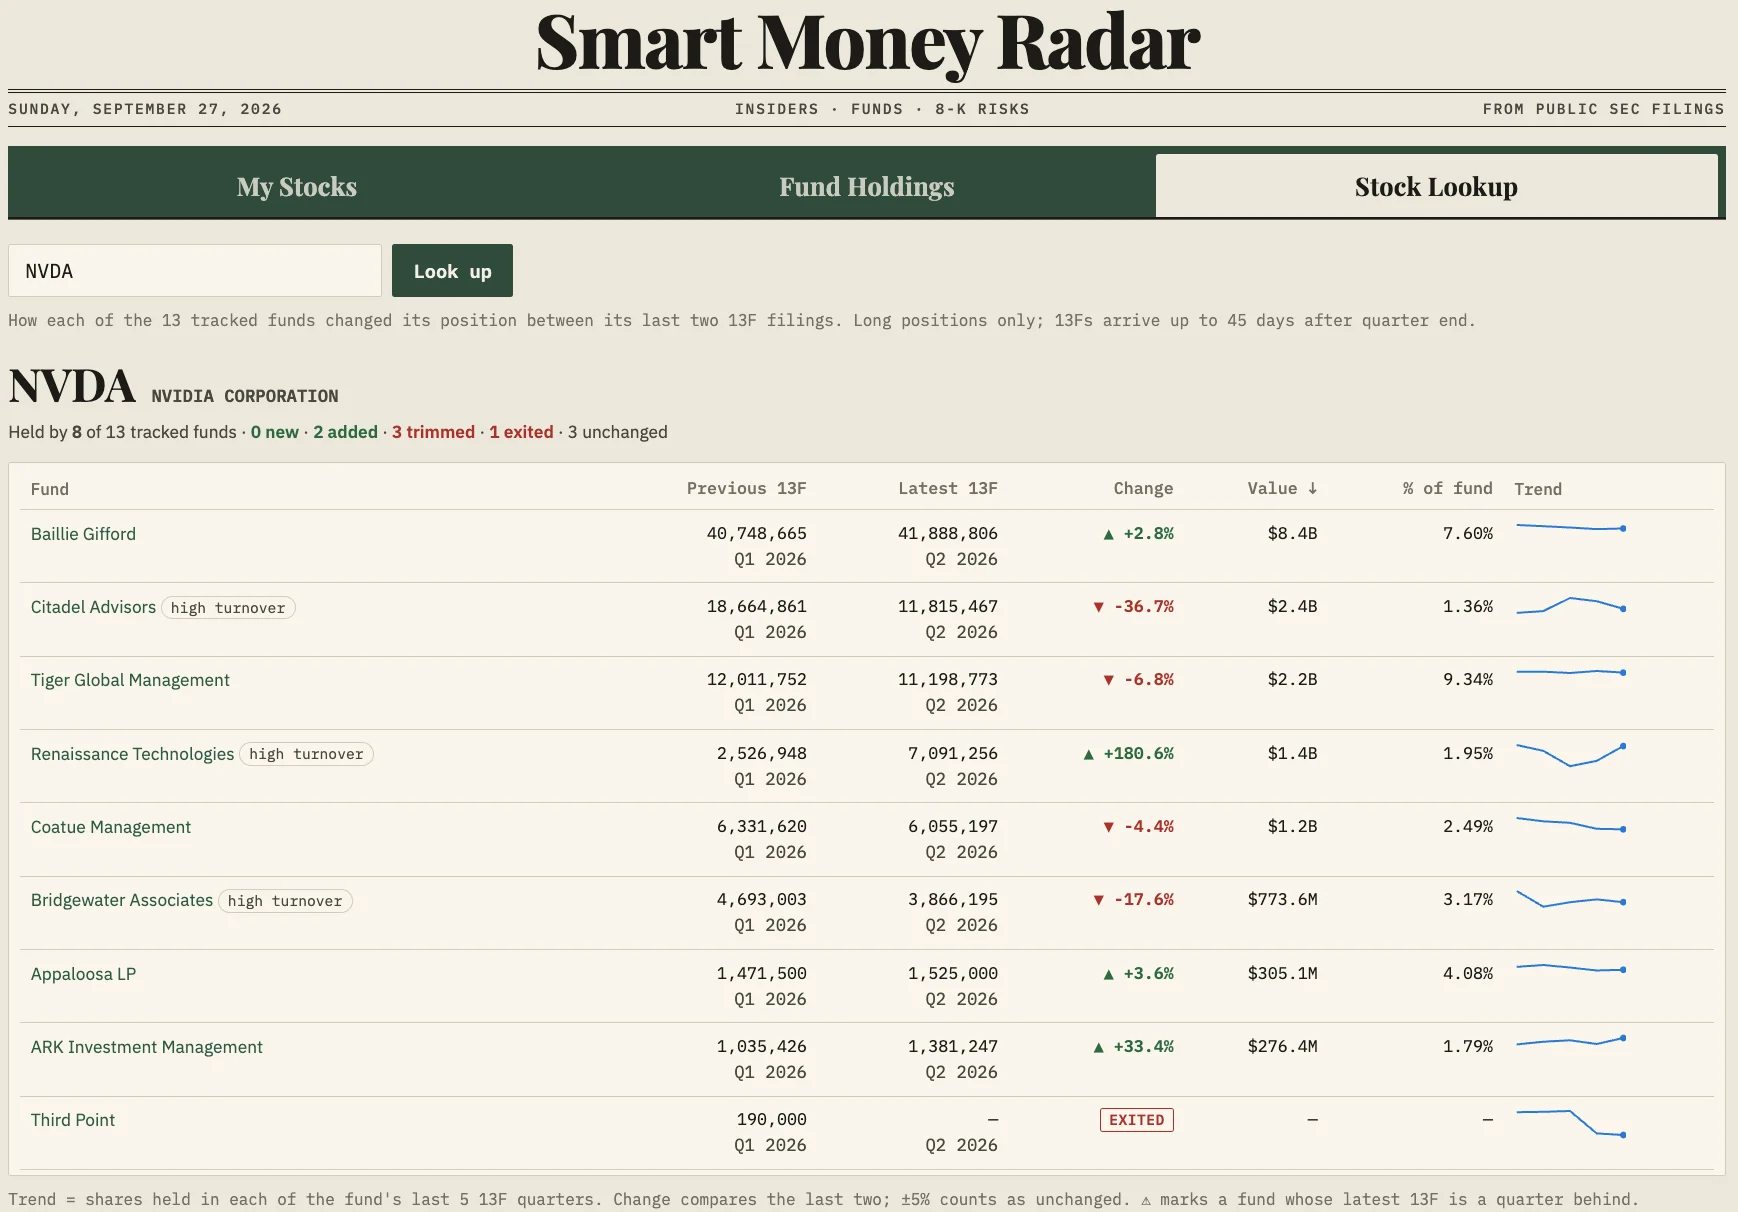
Look up any stock
Type a ticker and see every tracked fund's position in it: previous and latest 13F, % change, dollar value, weight in the fund and a five-quarter trend.
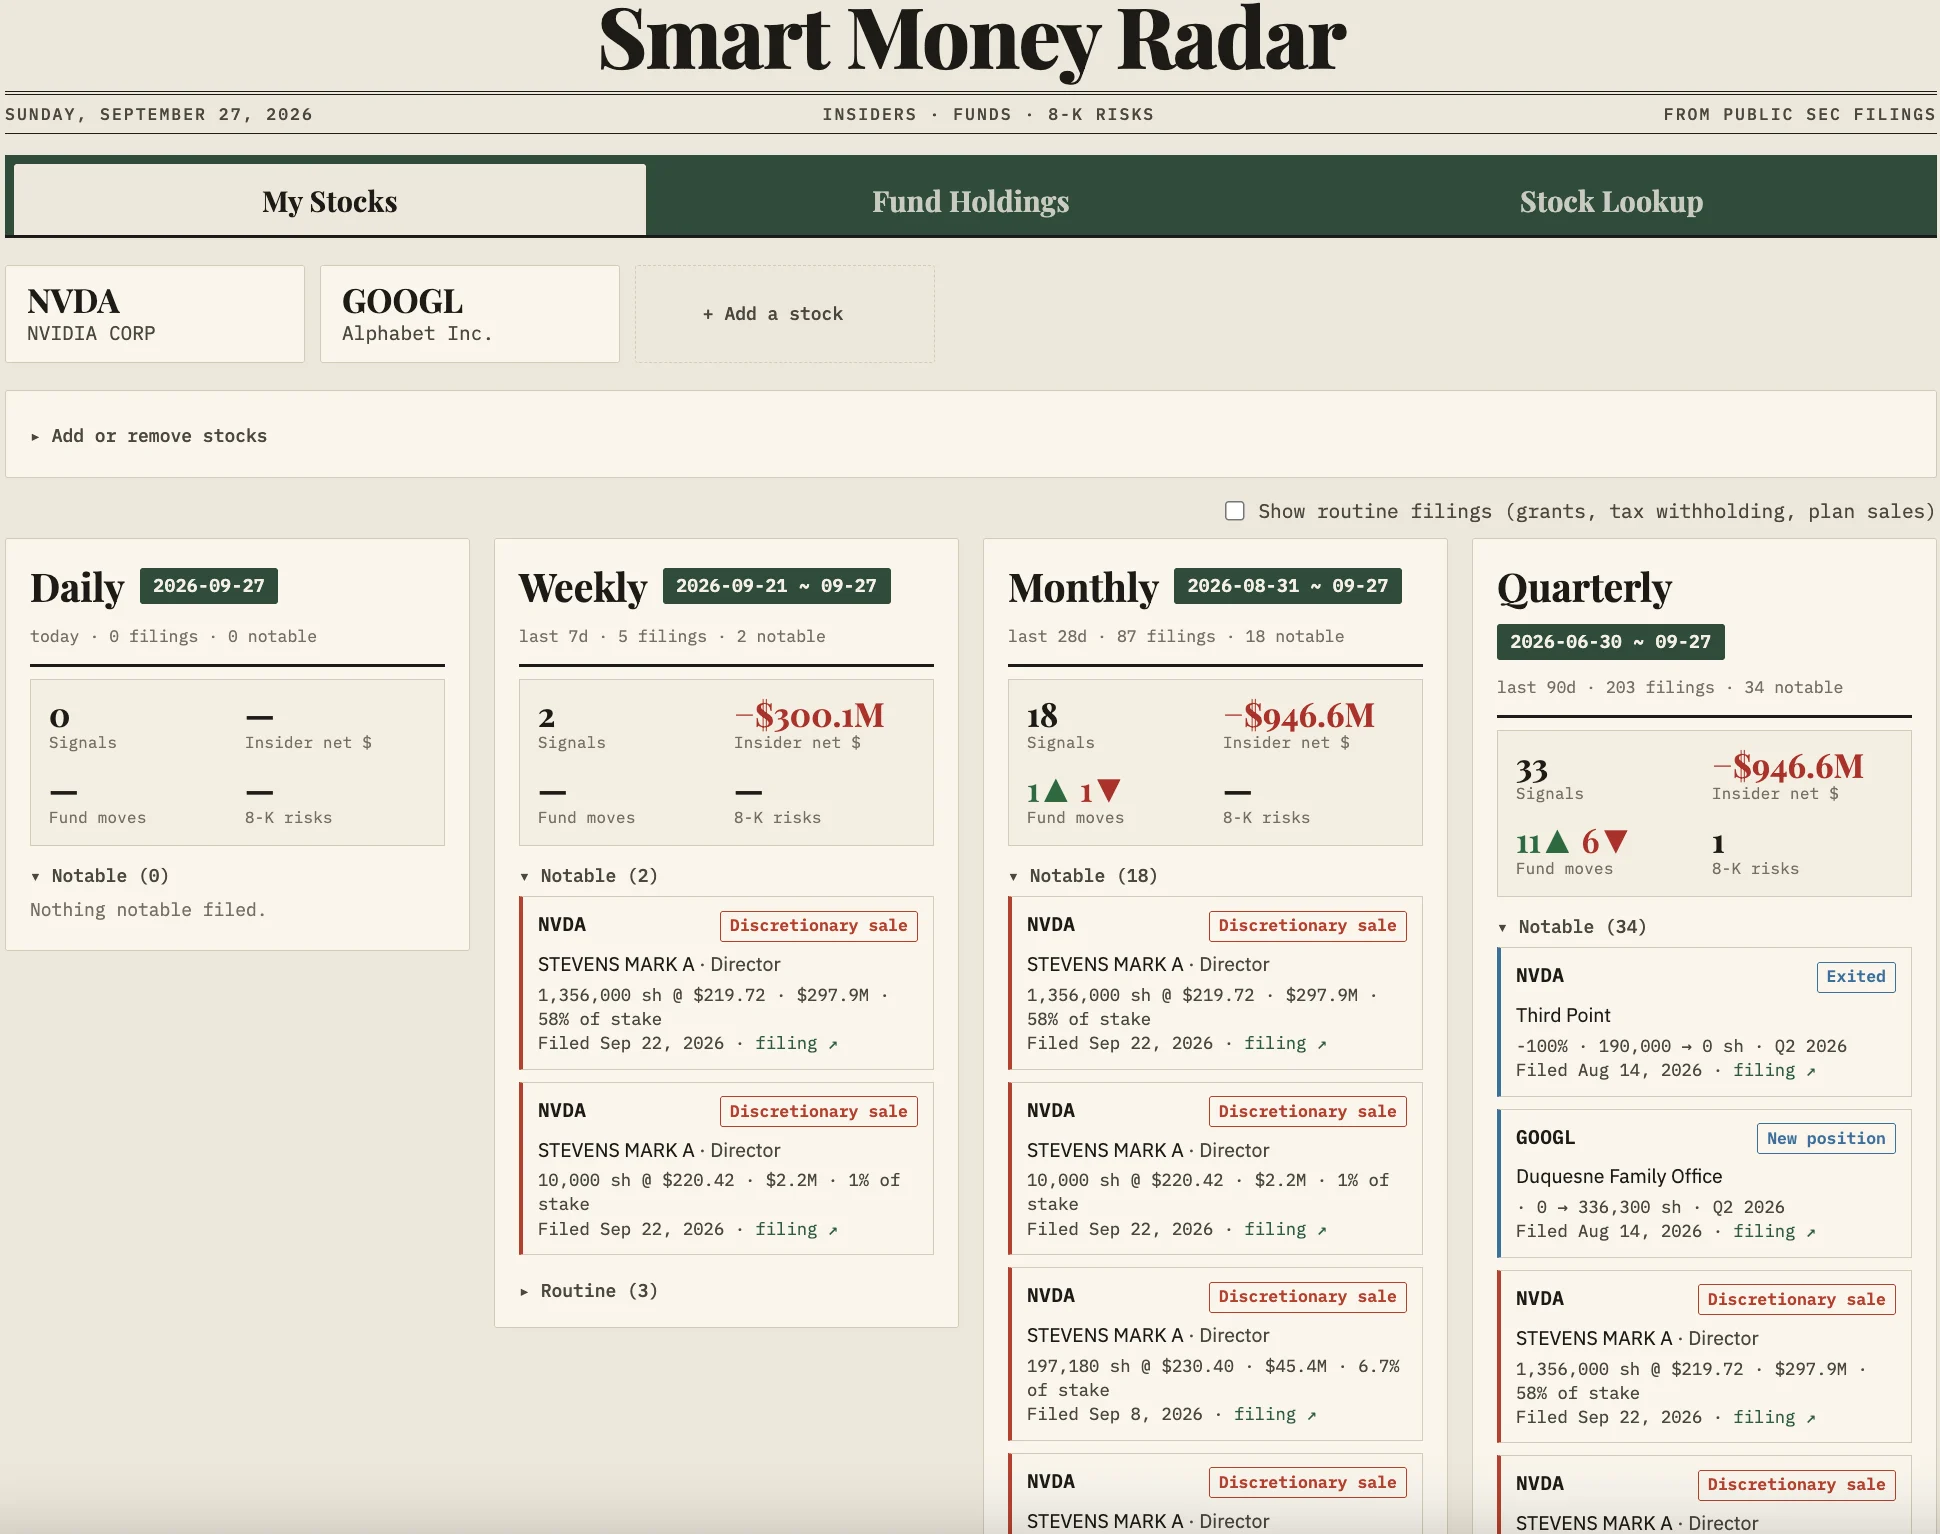
Watch the insiders at companies you care about
Add stocks to your watchlist and get a newspaper-style front page with today, the last 7 days, the last 28 days and the last 90 days side by side: open-market buys, discretionary sales, fund moves and 8-K red flags. Open any stock for a chart of the prices insiders and funds actually paid, and a running record of who has been accumulating and who has been selling.
Just ask
- "What did Berkshire buy last quarter?"
- "Which funds sold NVDA?"
- "What have insiders been doing at Alphabet?"
- "Any red flags in Meta's recent filings?"
Answers are built only from the filings, and every claim comes with a link. For a stock on your watchlist you get the bottom line first, then the most recent move that matters, who is positioned how, the turning points that changed the picture, and any red flags.
Why the numbers can be trusted
- Routine insider filings (grants, tax withholding on vested awards, pre-planned 10b5-1 sales) are kept separate from real buying and selling, so a scheduled sale doesn't look like a panic exit
- Filer mistakes are fixed: 13Fs reported in the wrong units are corrected, late "confidential" positions disclosed in amendments are merged in, and CUSIPs are mapped to tickers
- Funds whose latest 13F is a quarter behind are flagged, and high-turnover quant funds are labeled so their churn isn't read as conviction
How to use
- Start with a question, no setup needed: "What did Berkshire buy last quarter?" or "Which funds own NVDA?"
- Build a watchlist: "Track NVDA and GOOGL."
- Ask for the dashboard: "Show me my dashboard."
- Add or drop stocks anytime: "Also track META", "Stop tracking NVDA".
Input: tickers to watch. Fund questions and stock lookup need no input at all. No account numbers, no brokerage login, no personal financial data.
Output: an HTML dashboard file plus answers in chat, each linked to SEC filings.
Data sources & limits
- SEC EDGAR: Form 4 (insider trades, filed within 2 business days), 13F (fund holdings, filed up to 45 days after quarter end, long positions only), 8-K (material events)
- Ticker mapping via OpenFIGI open identifiers
- Charts use prices reported in filings; no third-party market-data license is involved
- Congressional trading is not included
Disclaimer
Smart Money Radar summarizes public SEC filings for research. It is not investment, tax or legal advice and does not recommend buying, selling or holding any security. Labels like "accumulating" or "distributing" describe filing activity, not predictions.
Externe API’s
SEC EDGAR (sec.gov) · OpenFIGI


