Tech News Cards — 12-Hour AI & Tech Brief
Tech News Cards
Twelve hours of AI and tech news, as a finished carousel — in English and Traditional Chinese.
Overview
Ask for today's tech news and you get a finished carousel, not a list of links.
Every card traces to a real, timestamped item published inside the window — the
skill fetches live feeds on every run and never writes a headline from model
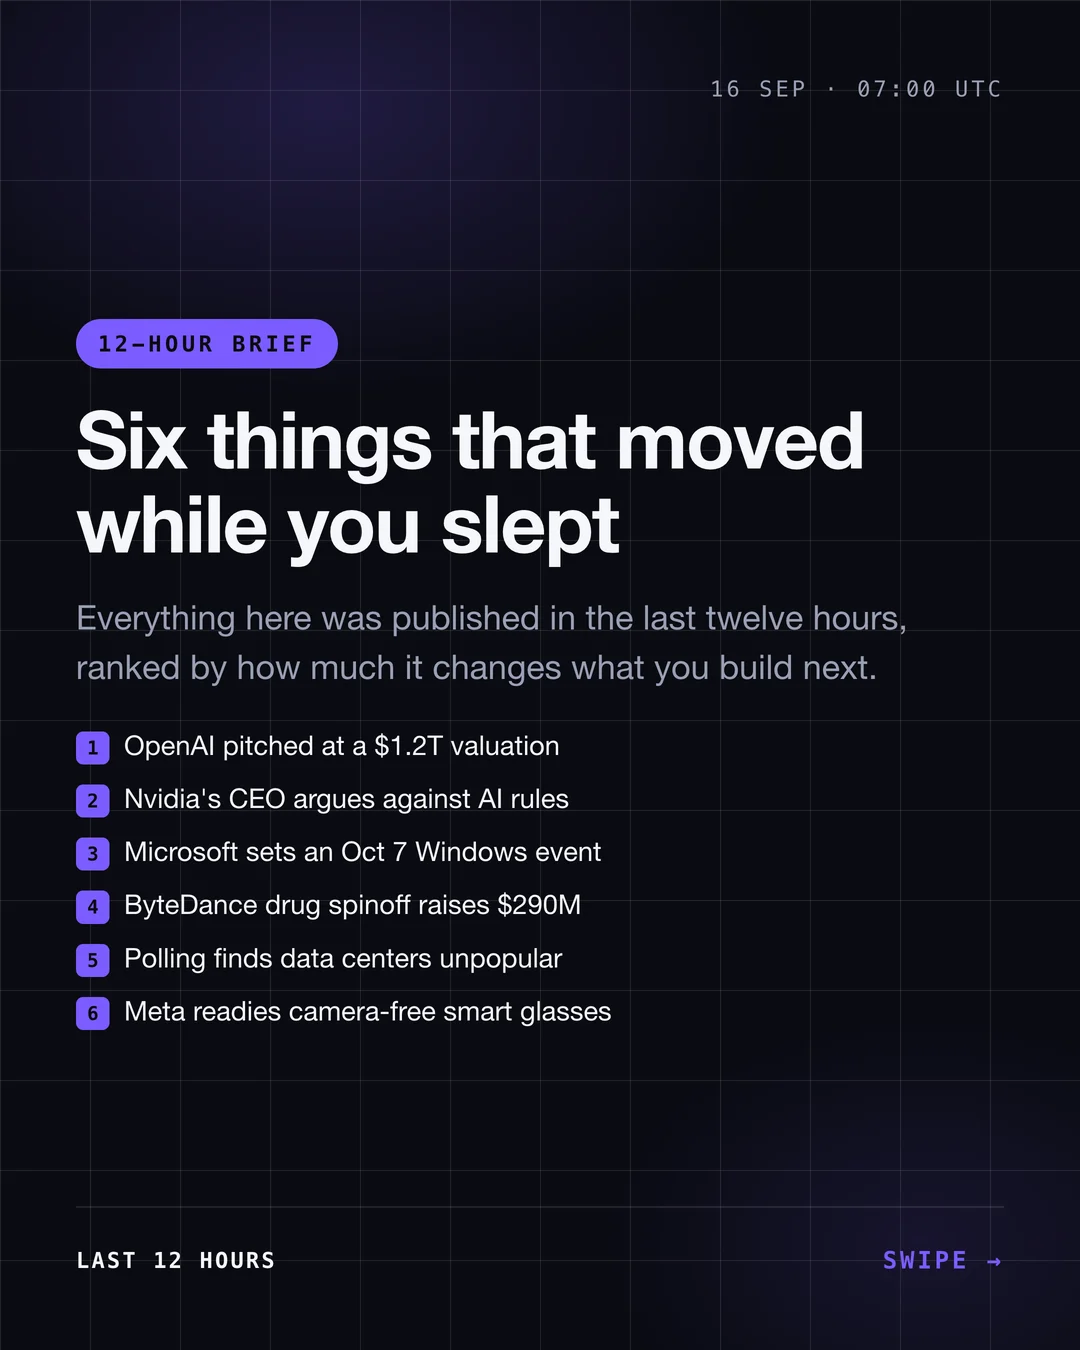
memory. The cover lists every story in the deck, and each story card carries a rewritten
headline, what happened, why it matters and its source. Drop the folder
straight into your scheduler.
When to Use / Best For
You post a daily or twice-daily tech brief. A newsletter, a LinkedIn page, an
X account, an Instagram tech feed. This is the whole production step: research,
editing, design and export in one run, with a consistent look every day.
You run a team standup or internal digest. Point it at --topics security or--topics chips and get six cards on exactly your beat, sourced and dated, ready
to drop into Slack.
You need the same brief in several places. One deck renders to Instagram
portrait, X wide, Stories vertical or Slack square. Each extra format is one more
request, rendered from the same deck with no refetch and no re-editing.
You are tired of AI-written news that is three months stale. Every run hits
live RSS and JSON endpoints. If the last twelve hours were quiet, the skill tells
you so and offers to widen the window rather than padding the deck.
How It Works
Step 1 — Say what you want. Topic, platform and handle, or nothing at all.
Defaults are a 12-hour window, six stories, Instagram portrait, dark theme.
Step 2 — Live fetch. 24 sources in parallel: Techmeme and Hacker News for
signal, OpenAI / DeepMind / NVIDIA / Microsoft / AWS / Apple / GitHub / Hugging
Face for first-party announcements, TechCrunch / The Verge / Ars Technica / WIRED
/ MIT Tech Review and more for reporting, plus arXiv for research. Anything older
than the window is dropped before ranking.
Step 3 — Read the reporting. Most tools summarise a 300-character RSS blurb.
This one opens the article behind it — 3,000 to 20,000 characters — and pulls the
figures, the caveats and the direct quotes that the blurb drops. Roughly three in
four articles open; paywalled ones fall back to the summary and say so.
Step 4 — Rank and de-duplicate. Stories are scored on recency, source weight,
how many outlets corroborated them, Hacker News traction and topic match. The
same story from six outlets collapses into one card that credits the rest. A
per-outlet cap stops one aggregator owning the deck, and a commerce filter keeps
coupon posts out.
Step 5 — Edit. Each story is rewritten to card length: a 6–12 word headline,
two lines of what actually happened, one builder-facing why-it-matters line, a
category tag and the single number that carries the story. Hedged claims stay
hedged — "in talks to acquire" never becomes "acquires".
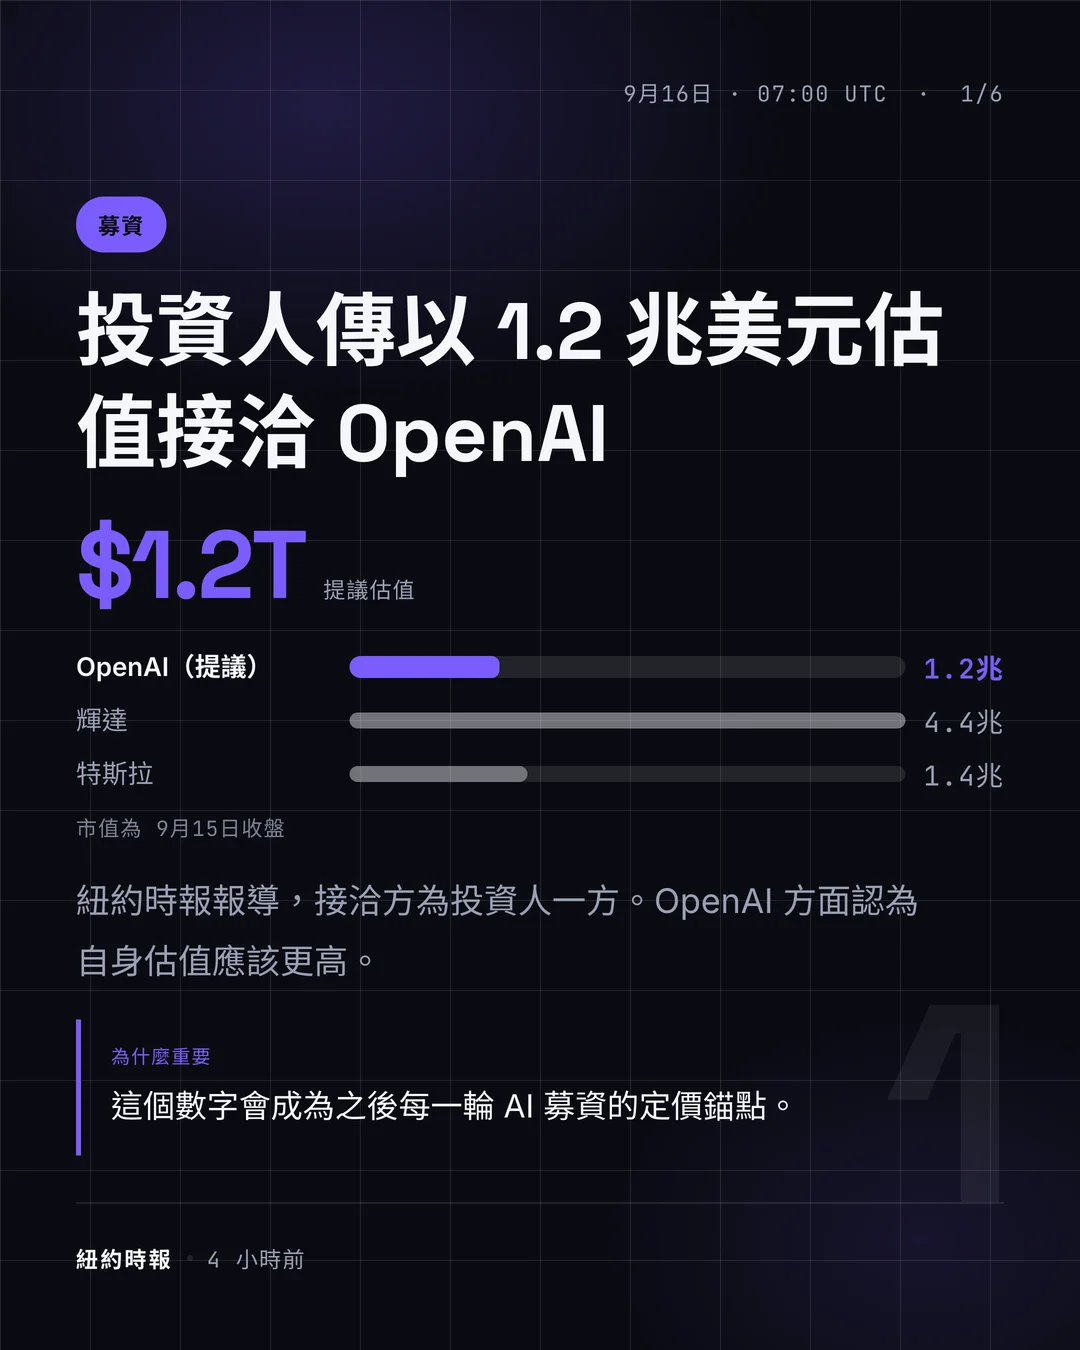
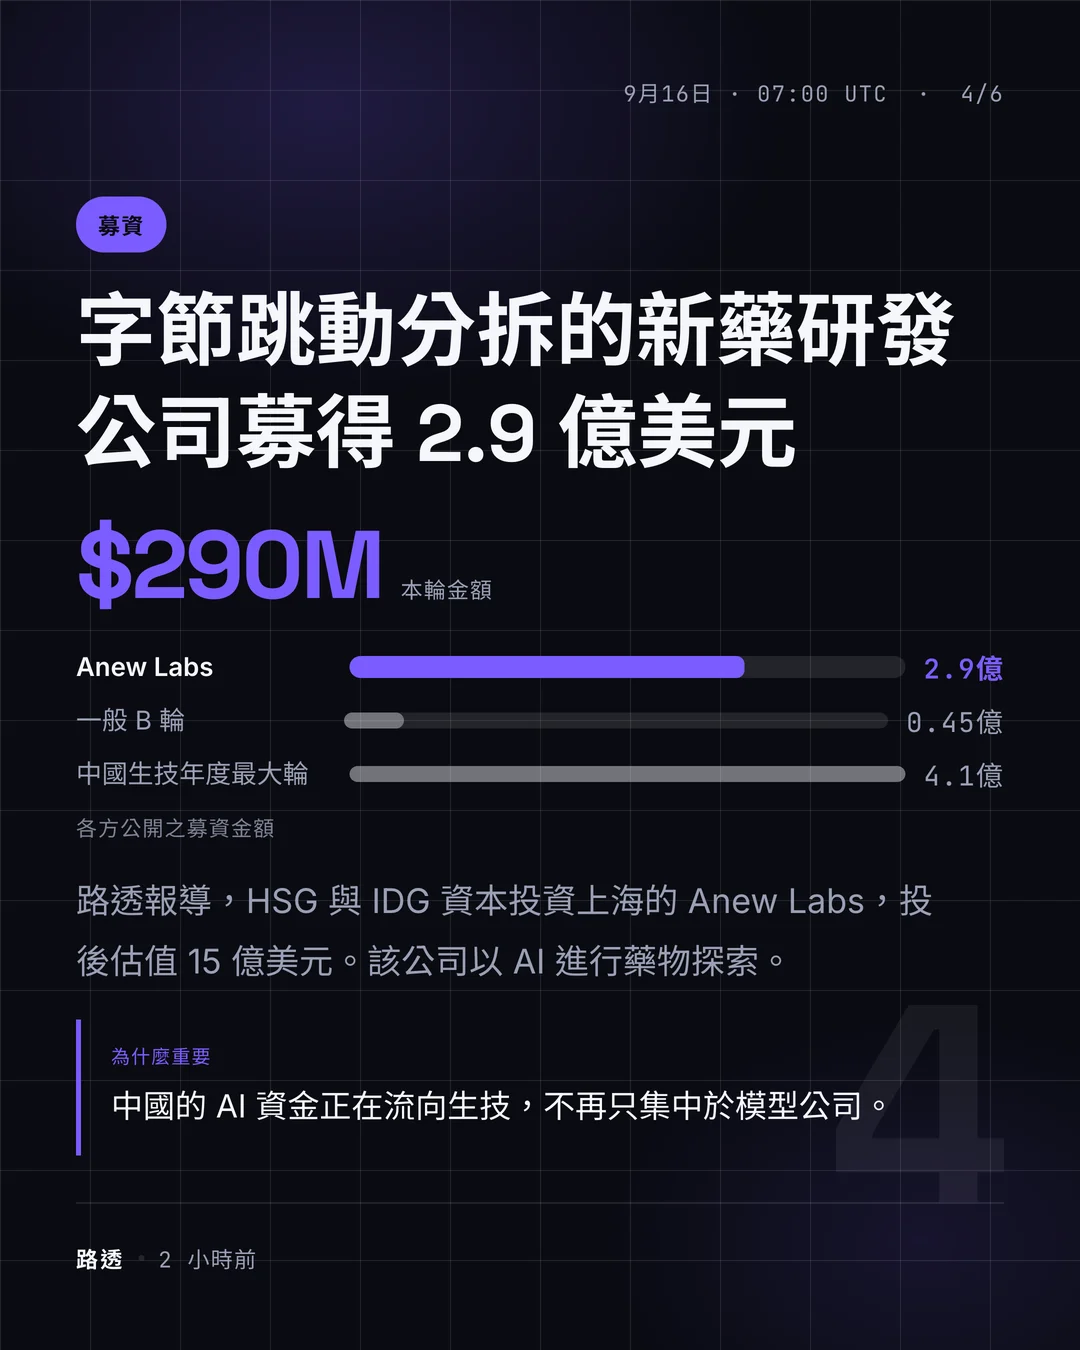
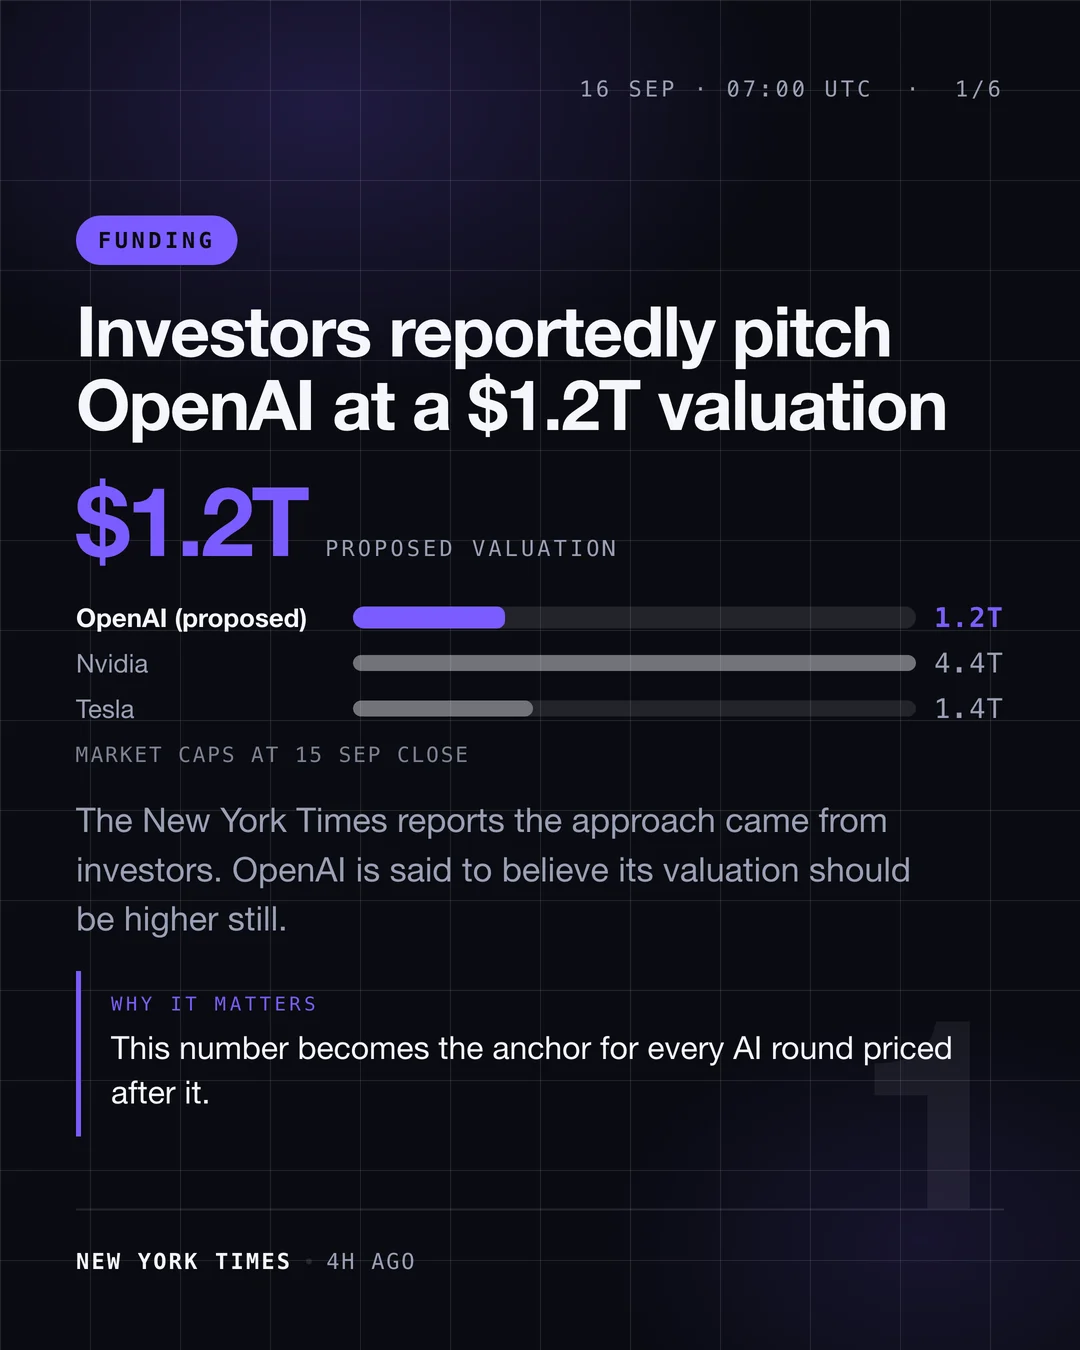
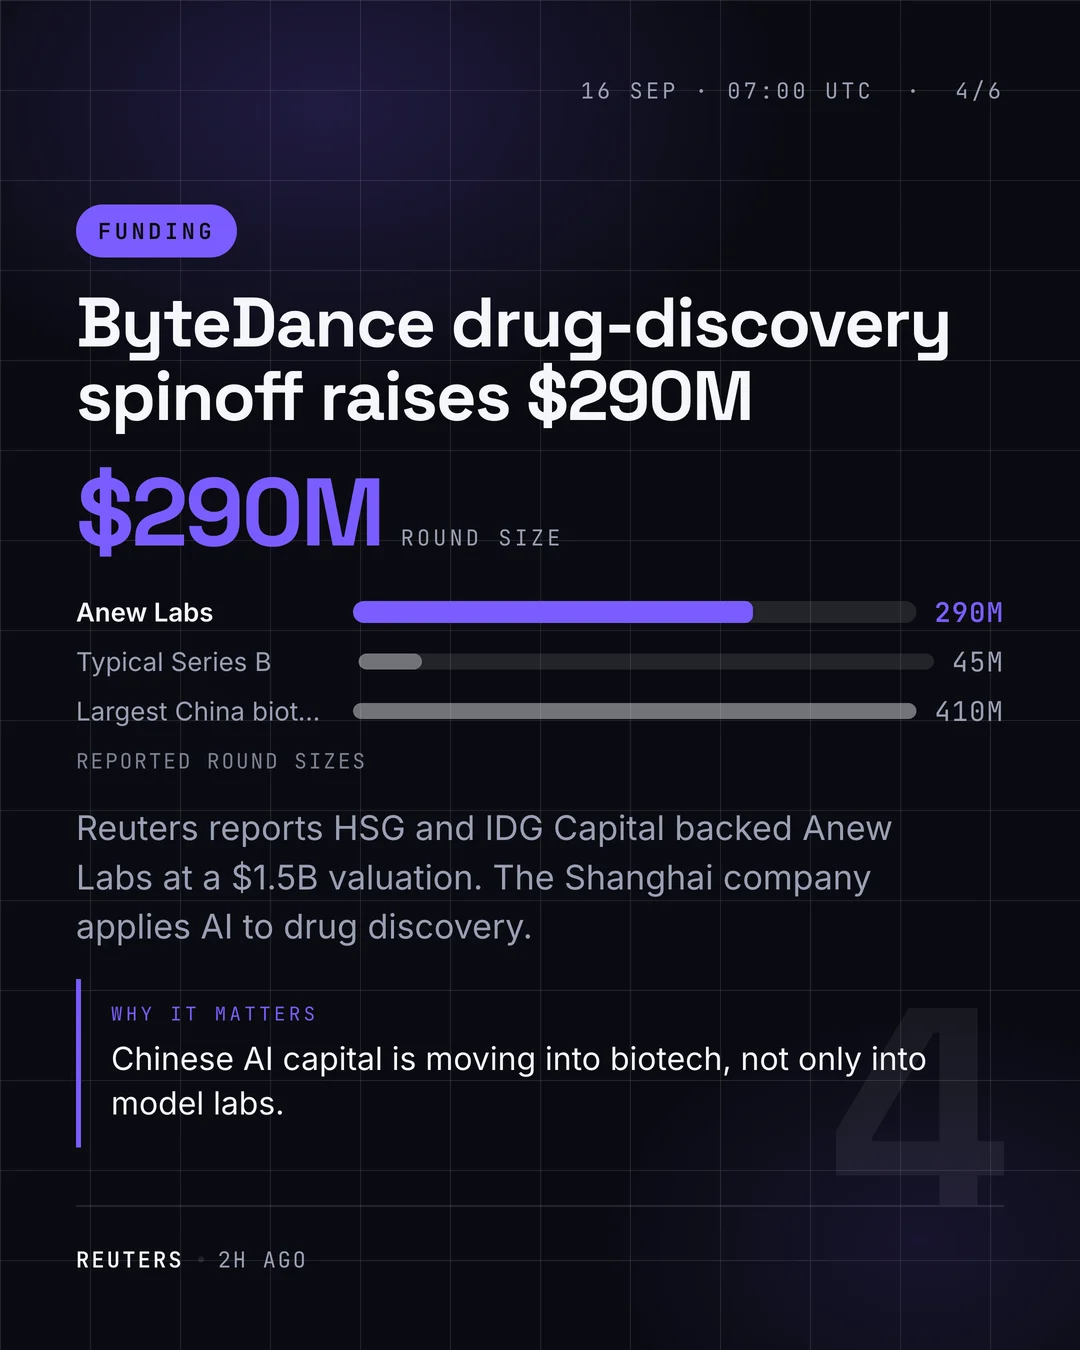
Step 6 — Put the number in context. $290M means nothing on its own. Each
card's figure is drawn as a bar beside two or three references — the round before
it, the obvious competitor, the category norm — so a reader knows in one second
whether the number is big. Every comparison comes from the reporting, with its
source and date stated on the card.
Step 7 — Ship both languages. Every run produces an English and a Traditional
Chinese edition, each with its own cards and its own caption pack — an Instagram
caption, a numbered X thread with a source link per post, a LinkedIn post,
hashtags and alt text. The Chinese edition is written, not translated: same
reporting, same figures, rewritten so it reads as though it was drafted first. A
consistency check runs across the two before rendering, so a figure cannot drift
between editions.
Formats and Themes
| Format | Size (@2x) | Built for |
|---|---|---|
| Portrait | 2160×2700 | Instagram feed, LinkedIn, carousels |
| Square | 2160×2160 | Instagram grid, Slack, email |
| Story | 2160×3840 | Stories, Reels, Shorts |
| Wide | 2400×1350 | X, OG images, blog headers |
| Theme | Reads as |
|---|---|
| Midnight | Indigo on near-black with a faint grid — the default |
| Paper | Light, warm, editorial; prints well |
| Signal | Terminal green on black, for security and infra audiences |
| Press | Newsroom navy with amber, for policy and market news |
| Heat | Magenta on deep plum, built to stop a scroll |
| Mono | Greyscale, so your own brand colour can drive |
Set brand.accent to your hex and every kicker, rule, stat and numeral follows it.
Why This Skill / What Makes It Different
The window is enforced, not suggested. Items without a parseable publish date
are discarded, because "last 12 hours" is the entire premise. The output reports
how many stories were actually in the window.
Corroboration is part of the ranking. Two independent outlets running the same
story outranks one outlet's exclusive, and the card credits the others.
Editorial rules, not vibes. A shipped rulebook governs headline length, the
why-it-matters formula, the category taxonomy, and a banned-phrase list that keeps
"game-changer" and "this changes everything" off your feed. Numbers on a card must
appear in the source text — none are computed, converted or estimated.
Text is rendered, not generated. Cards are laid out in HTML and screenshotted,
so headlines are always spelled correctly and typography is exact — the failure
mode of AI-generated news graphics.
It reads the article. Nearly every AI news tool paraphrases the RSS blurb,
which is why they all say the same thin thing. This one opens the reporting and
takes the figures and quotes out of it. That difference shows up on the card.
Numbers arrive with context. A figure with nothing beside it is trivia. Every
stat is drawn against two or three references, sourced and dated, so the card
answers "is that a lot?" instead of leaving the reader to guess.
You get the post, not just the picture. Caption, thread, LinkedIn copy,
hashtags and alt text ship with every deck. The work after the cards is the work
most tools leave you.
Two languages, both written properly. English and Traditional Chinese every
run. The Chinese cards are not a translation layer bolted onto English ones —
they are written from the same reporting, set in proper CJK typography, with the
figures checked against the English edition so the two cannot disagree.
Nothing you post belongs to somebody else. No press photography, no borrowed
imagery, no logos, no trademark questions. The cards are type and data, all of it
yours to post.
Attribution follows the reporting. When an aggregator surfaces a story, the
skill follows the link to the outlet that actually broke it and credits that name
on the card — not the aggregator.
Zero setup. No API keys, no accounts, no paid news tier. Public feeds only,
and the renderer falls back gracefully if a browser is unavailable.
What You Get
- Two editions, English and Traditional Chinese, in their own folders
- One PNG per card (cover + stories) at 2x, ready to post
- A
captions.mdper edition: Instagram caption, X thread, LinkedIn post, hashtags, alt text - A
deck.jsonyou can edit and re-render without refetching - The ranked story list with source URLs, so every claim is checkable
- Up to 8 story cards per run, from a window of up to 24 hours
- Any additional format from the same deck as a follow-up request
Sample output
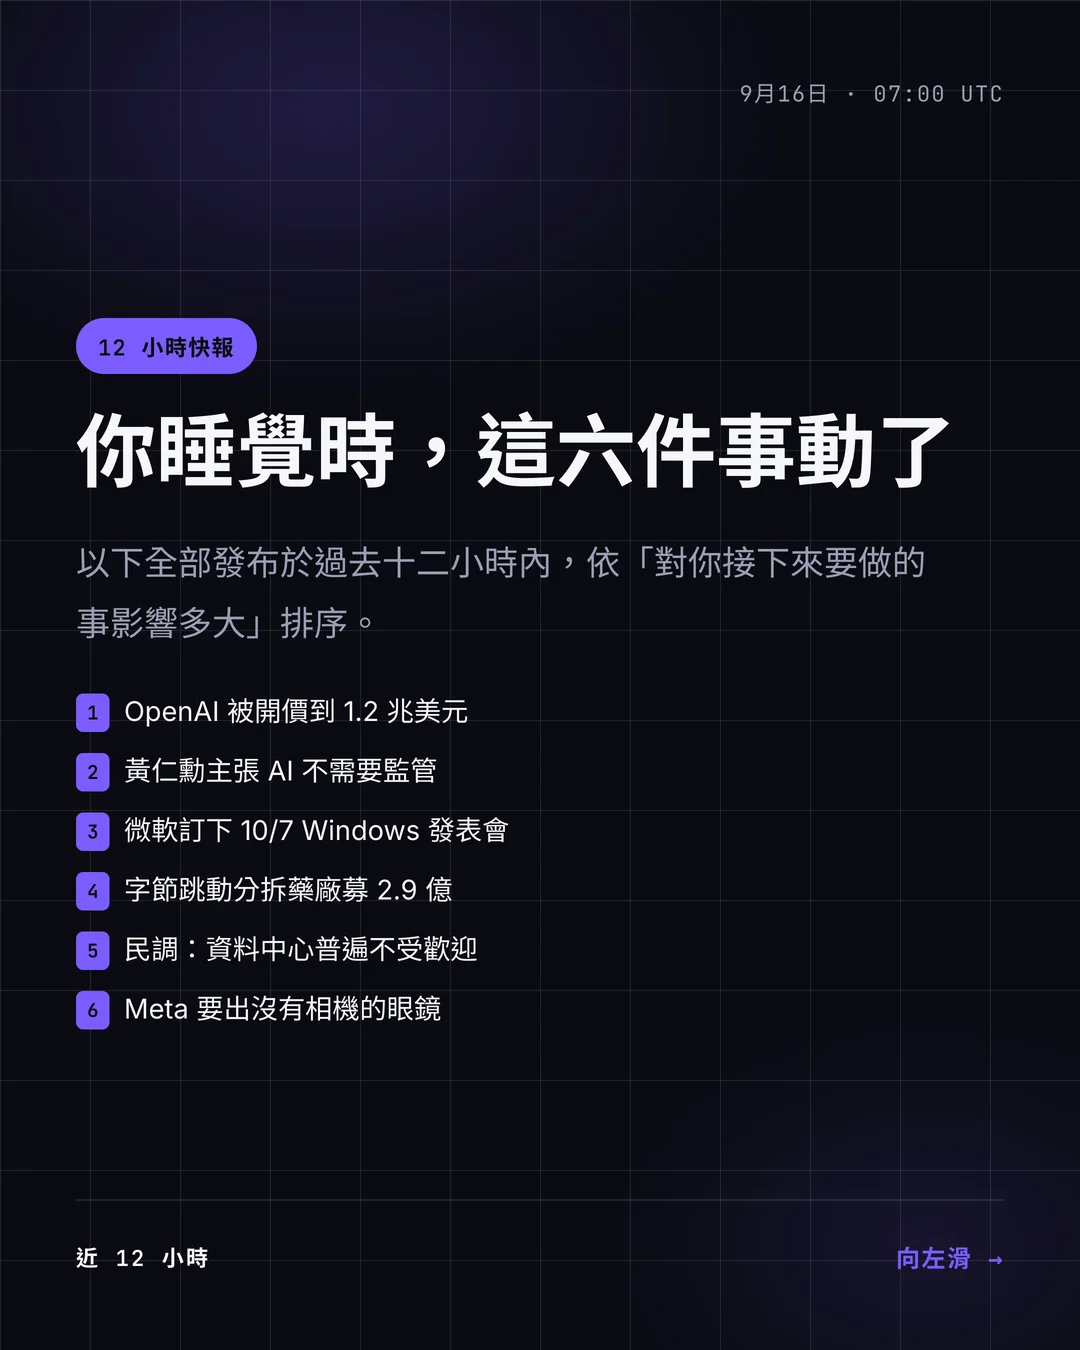
A real run, 16 Sep 2026. Cover, then two story cards with comparison bars.
English
繁體中文
Written from the same reporting, not translated.