
Data Report Dashboard — Local Kit (Download)
Data Report Dashboard
What you're buying: a download package (skill instructions + Python scripts) that runs on your own computer inside your own AI agent — it is not a cloud service.
You need: an AI agent that supports skills (e.g. Claude Code or Codex) — its subscription or API costs are yours; Python 3.9+ withpandas,openpyxlandmatplotlib.
Third-party services: none. Everything runs offline; Chart.js (MIT) is bundled inside the package. Your data's column names and summary statistics are seen by your own AI agent.
One Excel/CSV file plus one question in — an interactive dashboard your boss can read out.
What you get
- 📊 dashboard.html — a single file that opens offline and can be emailed as-is
- 3–6 KPI cards and 4–8 interactive charts (hover for values; every chart can expand into a value table)
- A sortable, searchable data table
- Light/dark toggle and mobile-friendly layout
- 🖼️ charts/*.png — one PNG per chart, ready for slides
- 📝 Key findings — 4–7 points plus suggested next steps, every number machine-checked
- 🧾 results.json — every computed result, fully traceable
Example
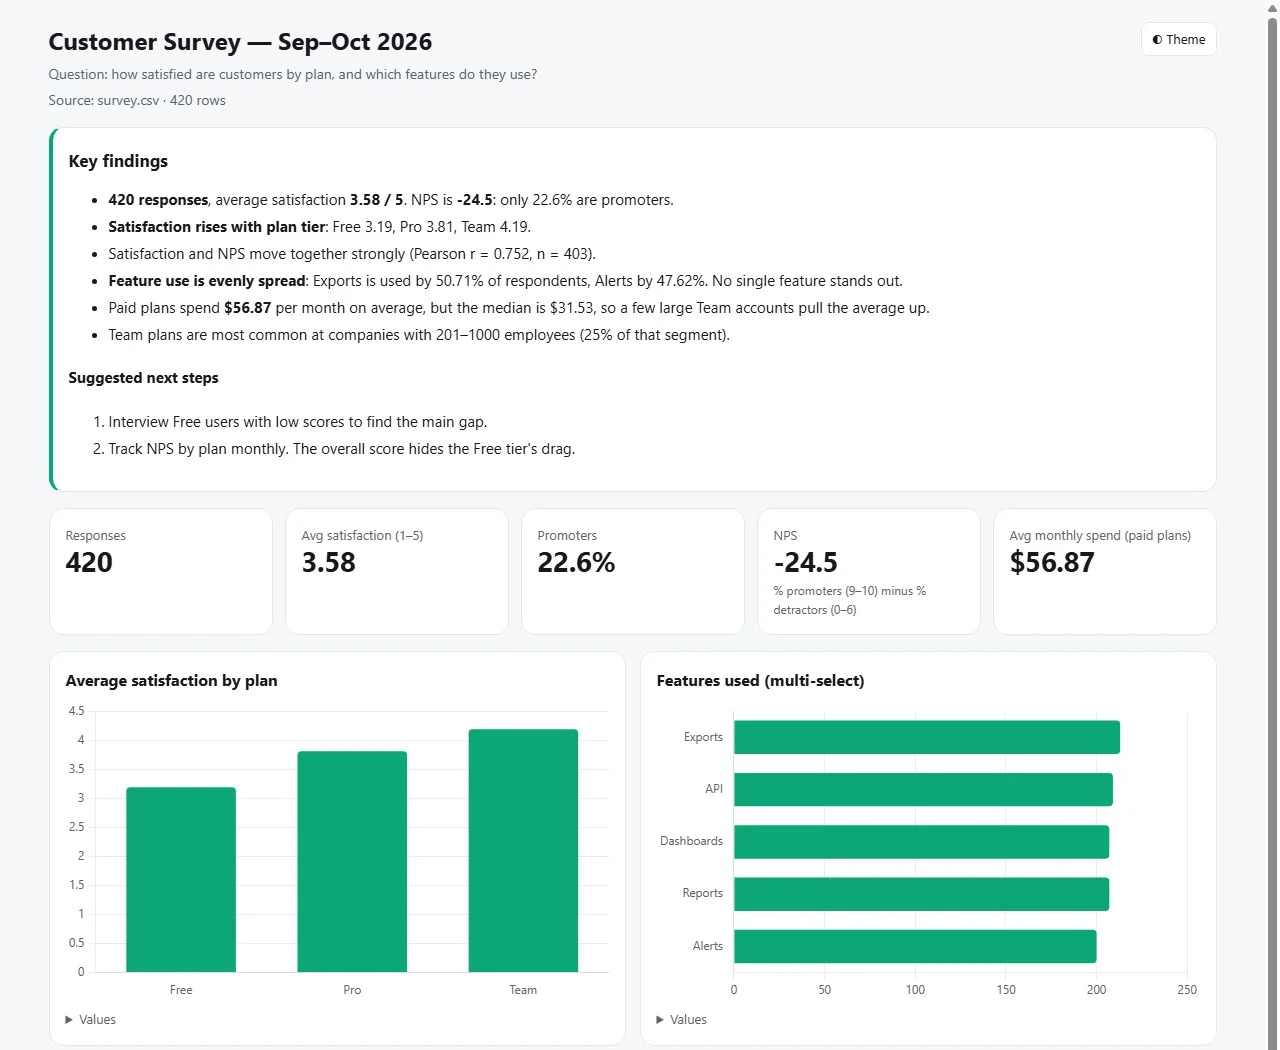
Survey (English): 420 responses → NPS −24.5, average satisfaction 3.58, satisfaction by plan, multi-select feature usage.
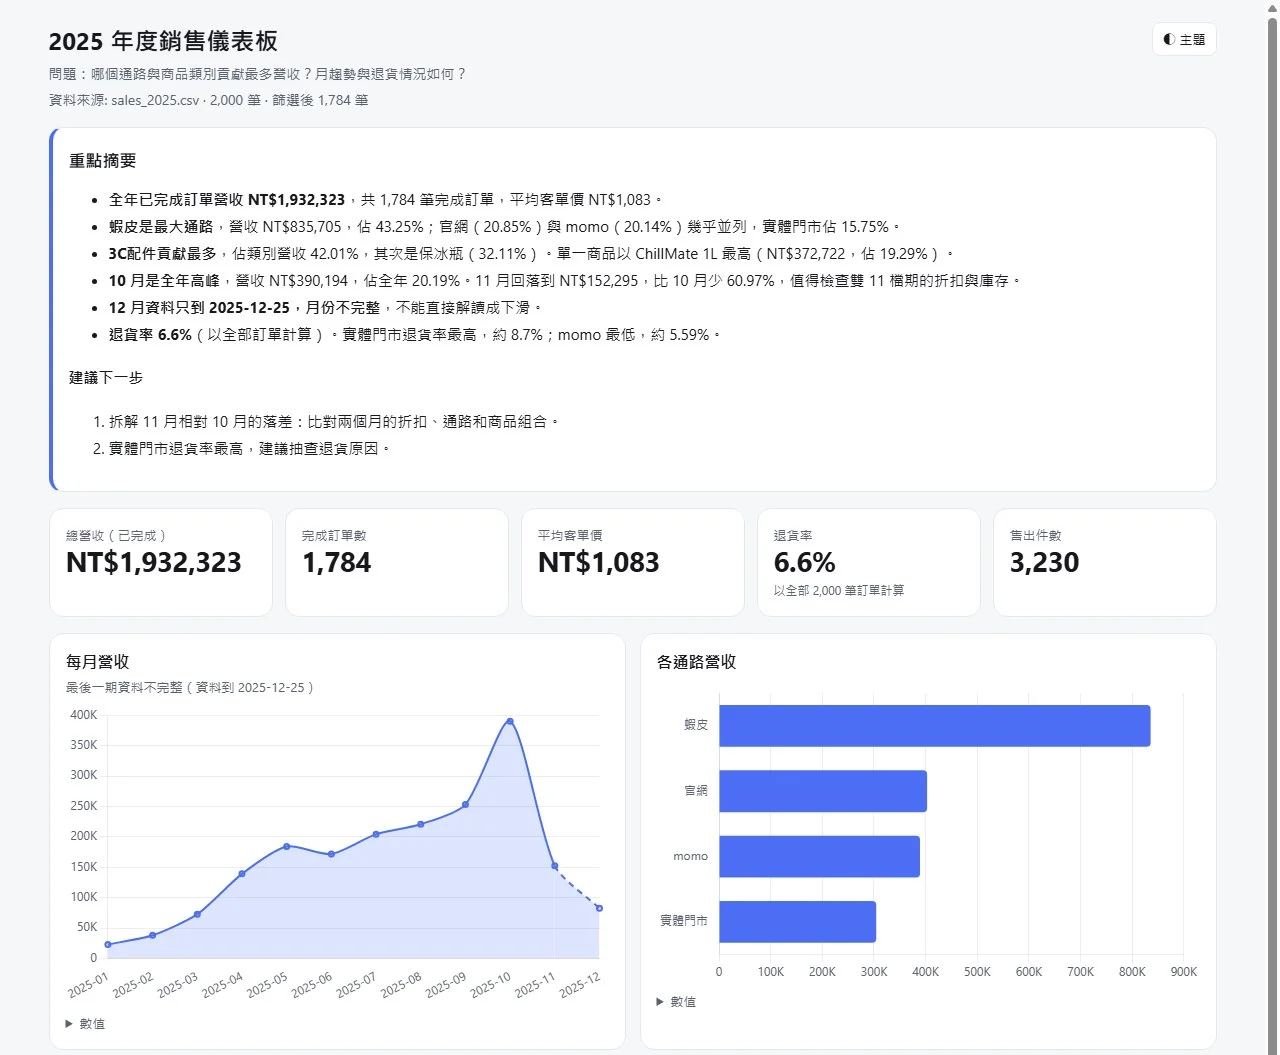
Sales: 2,000 e-commerce orders (Chinese column names). Question: which channel and category bring the most revenue, and how do monthly trends and returns look? Count only completed orders.
- 5 KPIs (revenue NT$1,932,323, 1,784 completed orders, AOV NT$1,083, return rate 6.6%, 3,230 units), 7 charts and a 500-row table — one 254 KB HTML file
- Findings such as "Shopee is 43.25% of revenue", "October is the peak" and "December data ends on 12-25, so the month is incomplete" — every number matched results.json
- All figures cross-checked with an independent pandas script: identical
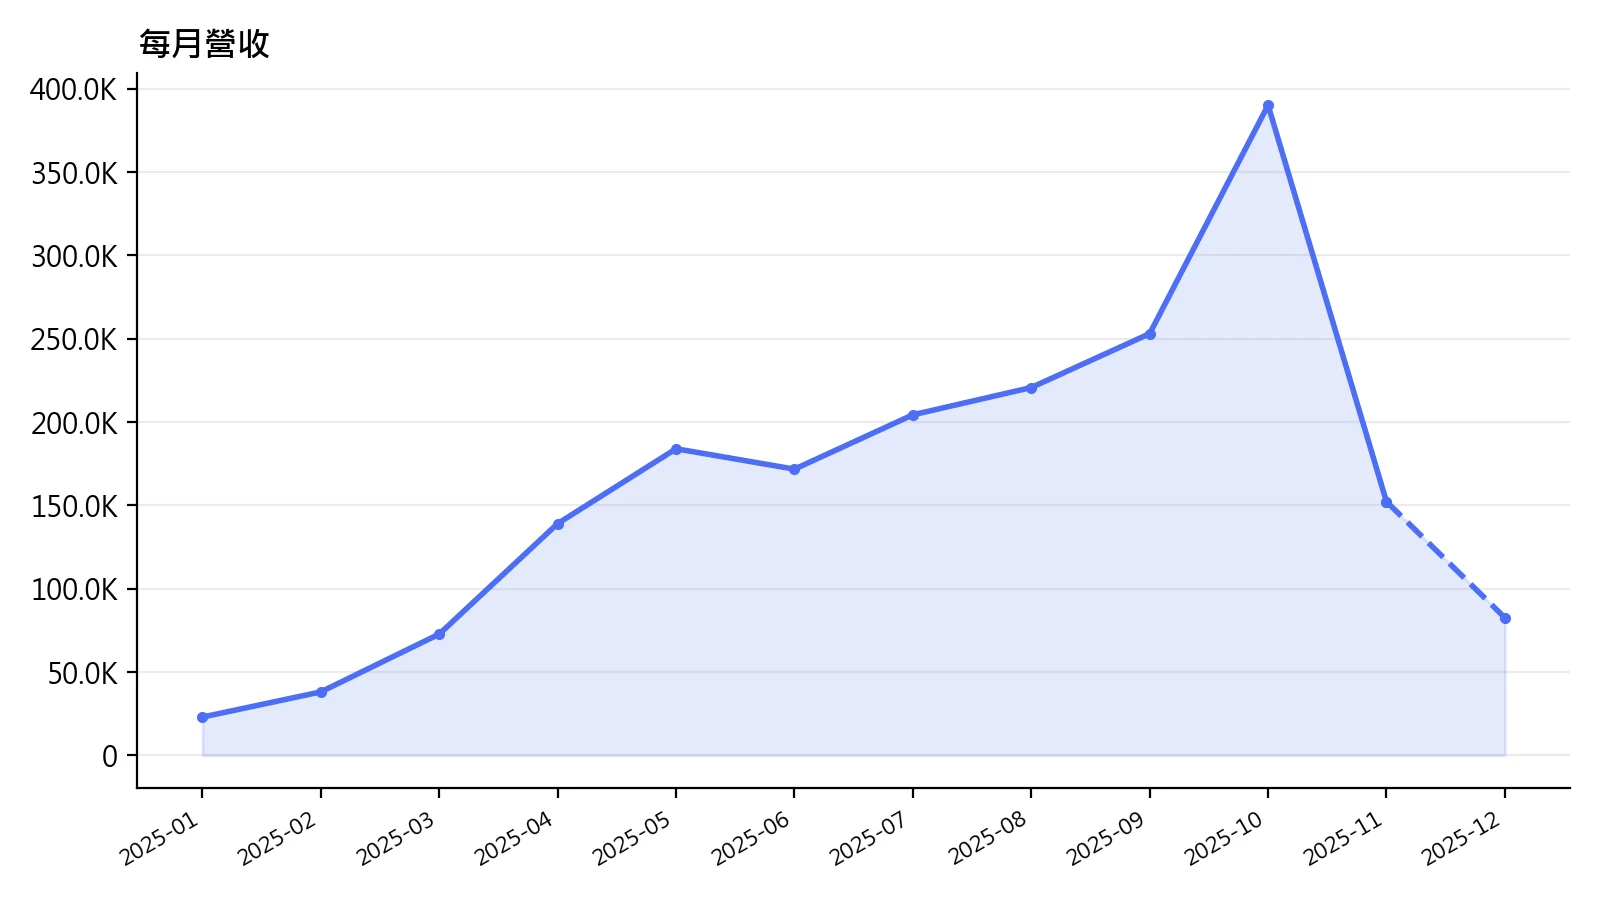
Every chart is also exported as a PNG, ready for slides:
Try it — copy a prompt
- "Here's
sales_2025.xlsx— which channels and products drive revenue, and what's the monthly trend? Completed orders only." - "Build a dashboard from
survey.csv: NPS, satisfaction by plan, and which features people use."
Why buy it
One payment, a dashboard for every report — no BI subscription, no per-seat fees, and your data never leaves your computer.
Who it's for
Managers, analysts, marketers, e-commerce sellers, researchers and anyone who gets "can you make this into a report?" every week.
Why you can trust the numbers
- The AI doesn't do the maths: sums, averages, shares and growth rates are all computed by pandas
- Findings are auto-checked: every number in the summary must exist in the computed results — otherwise output is refused and the bad numbers are listed
- Common traps caught automatically: an incomplete last month (not mistaken for a drop), ID columns that must not be summed, outliers, "NA" misread as missing, and more
Supported analysis
- Derived columns (e.g. revenue = price × quantity × (1 − discount)) and filters (e.g. completed orders only)
- Time trends (day, week, month, quarter, year; missing periods filled with 0), rankings, composition, 100% stacked, distributions, correlation
- Survey multi-select answers ("Reports;API" is split automatically, with % of respondents per option)
- Ratio KPIs such as NPS, return rate and conversion rate
- 4 colour themes; interface in English or Traditional Chinese, findings in any language
Requirements
- Python 3.9+
pip install pandas openpyxl matplotlib- Reads CSV, TSV and XLSX (encoding detected automatically, including UTF-8, Big5 and CP950)
Limitations (please read)
- This is descriptive analysis: no forecasting, significance testing or causal claims — the summary avoids "A caused B".
- Not financial, tax or investment advice.
- One file and one sheet at a time; no database connections.
- Findings are written by AI; the numbers are checked, but the interpretation is yours to judge.
- The data table embeds up to 500 rows (adjustable); very large data makes the HTML bigger.
Files
SKILL.md— agent workflowscripts/profile_data.py— data health check (types, missing values, outliers, date range)scripts/build_dashboard.py— calculations, dashboard, PNGs and results.jsonscripts/check_numbers.py— summary number checkscripts/vendor/— Chart.js 4.4.1 (MIT)references/— chart-choice guide, plan format, English and Chinese examples with sample data


