

Financial Modelling Agent
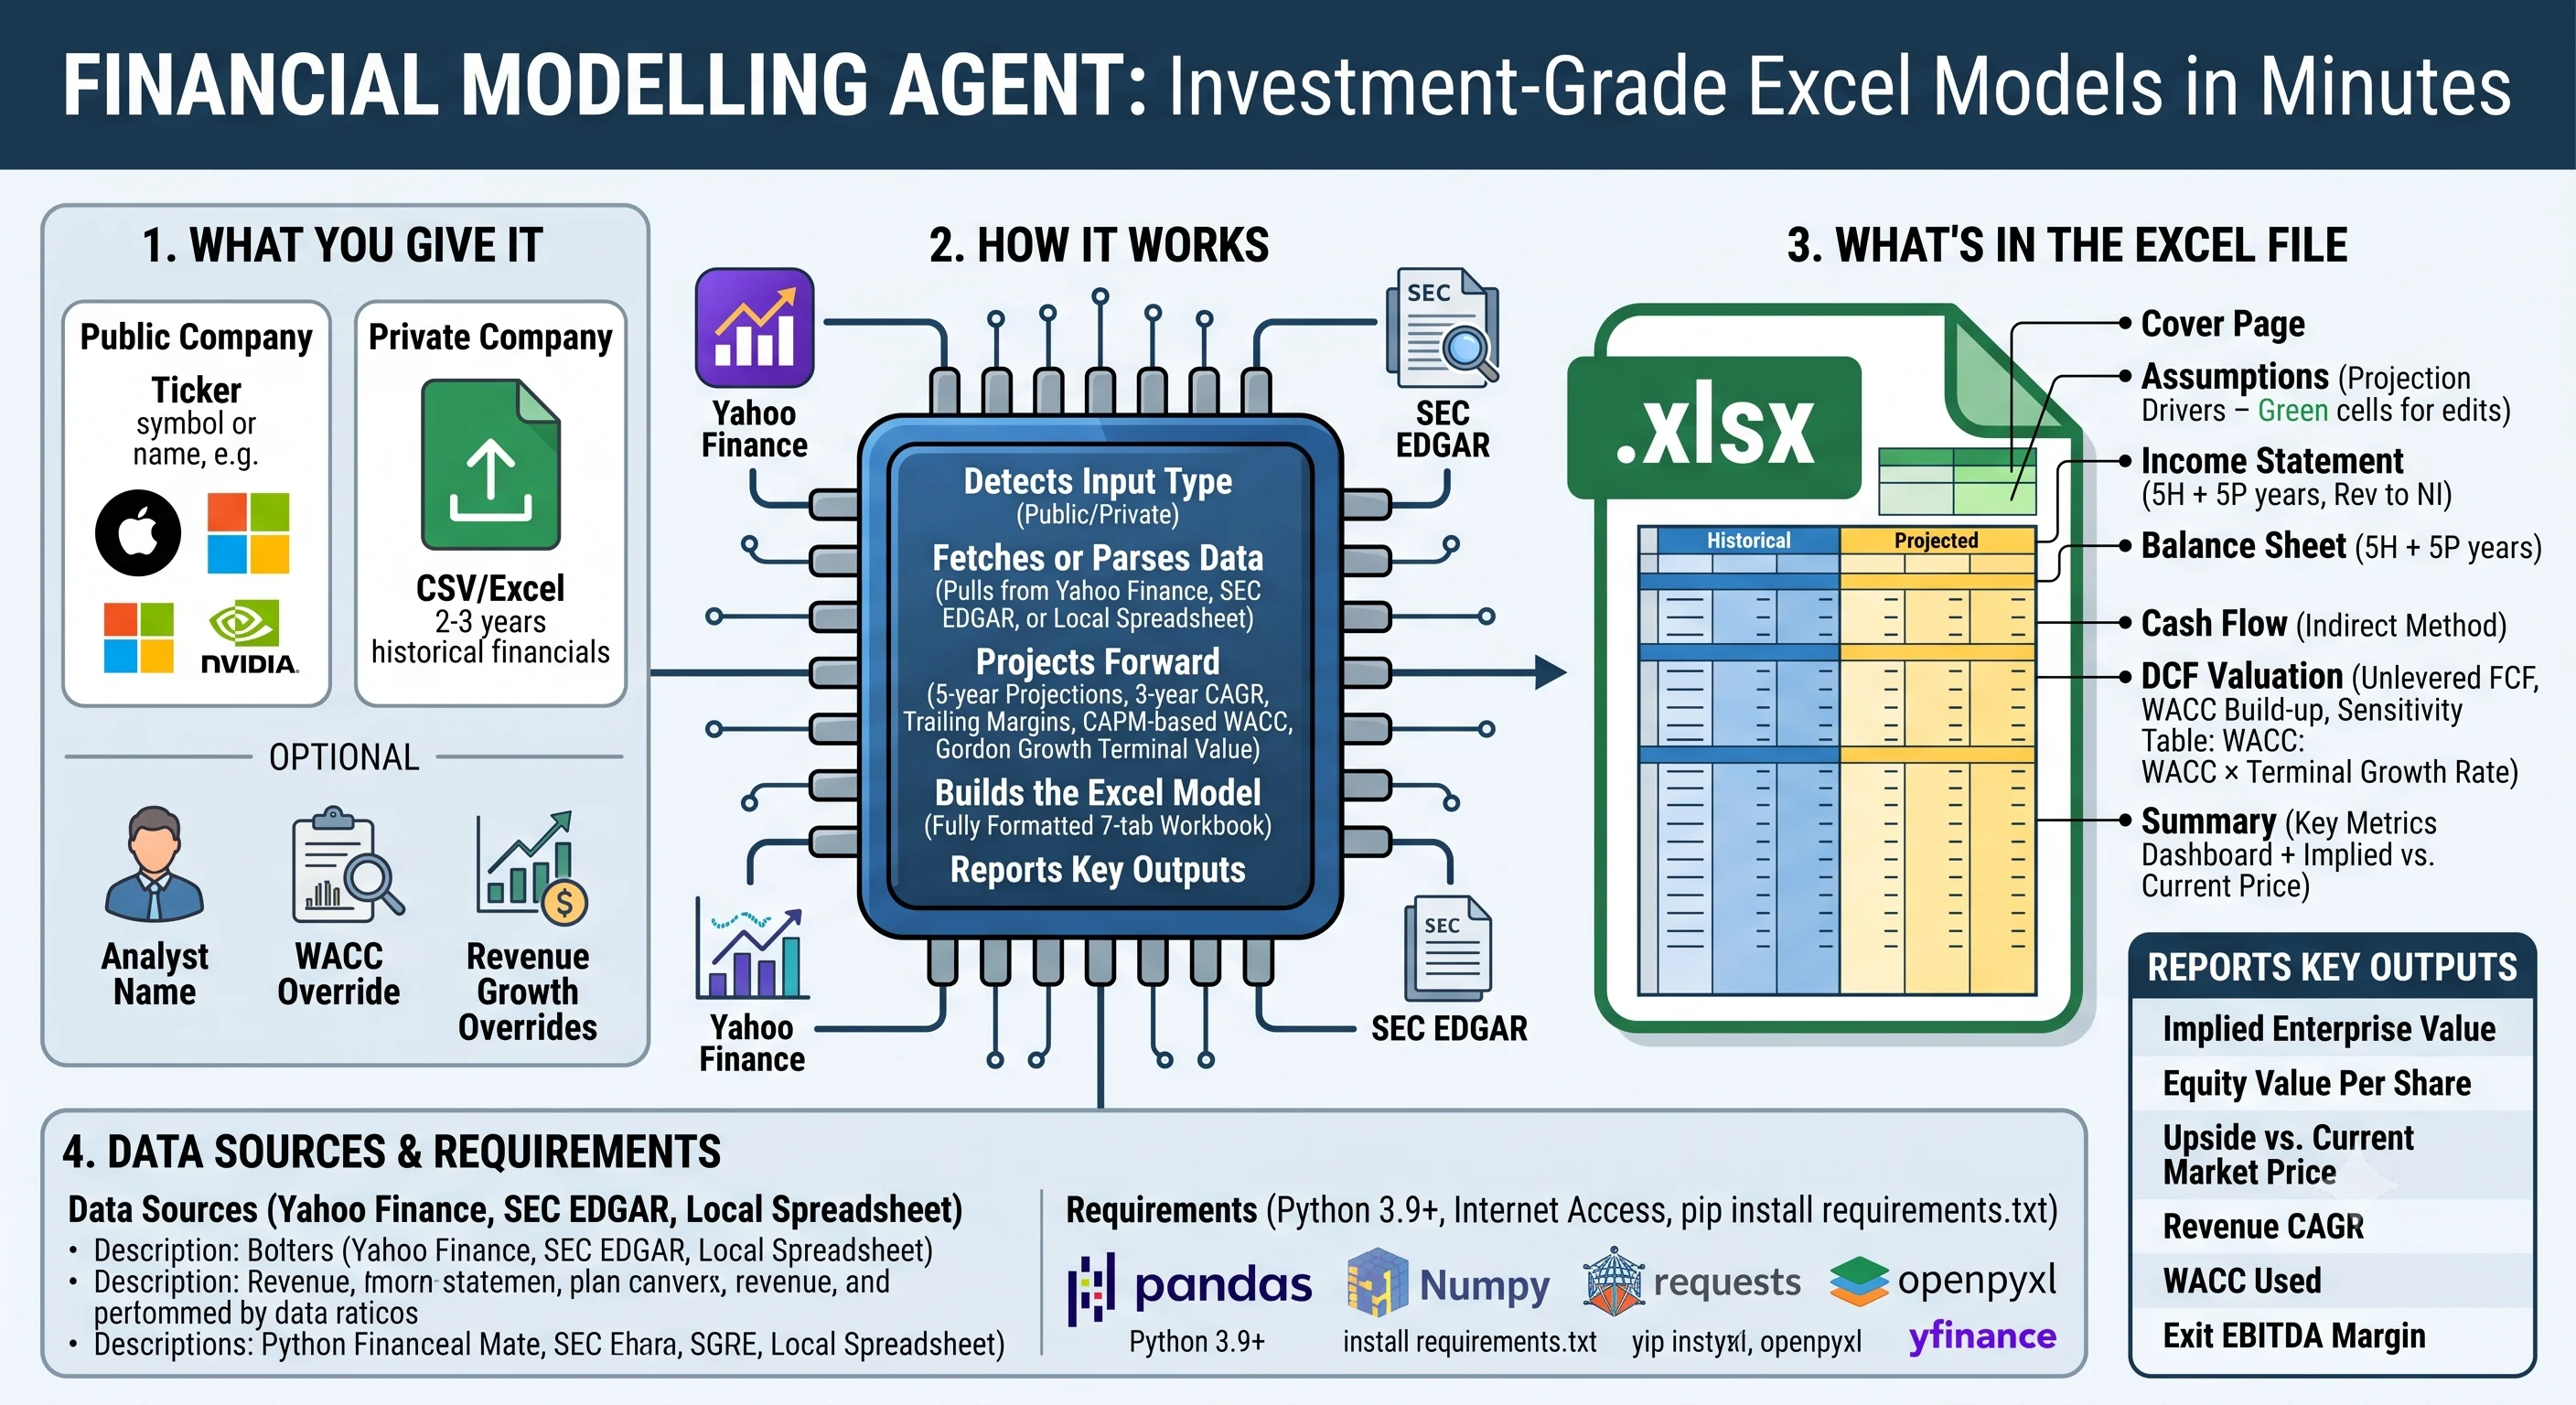
What it does
Builds a polished, investment-grade Excel financial model for any company — a 3-statement model (Income Statement, Balance Sheet, Cash Flow) integrated with a DCF valuation. Takes 2–5 minutes and outputs a fully formatted, ready-to-use .xlsx file.
What you give it
Public company — a ticker symbol or company name (e.g. "AAPL", "Microsoft", "Nvidia")
Private company — an Excel or CSV spreadsheet with 2–3 years of historical financials (revenue and net income minimum; full income statement ideal)
Optional: analyst name for the cover page, WACC override, revenue growth overrides.
How it works
Detects input type — determines public vs. private and asks for the analyst name
Fetches or parses data — for public companies, resolves the ticker and pulls 5 years of annual financials from Yahoo Finance, with CIK and filing metadata from SEC EDGAR; for private companies, parses the spreadsheet locally and maps columns to a standard schema
Projects forward — builds 5-year projections using 3-year historical CAGR (fading to 5%), trailing-average margins, a CAPM-based WACC, and a Gordon Growth terminal value
Builds the Excel model — writes a fully formatted 7-tab workbook; historical columns in blue, projected columns in yellow, user-editable inputs highlighted in green on the Assumptions tab
Reports key outputs — shares the file path and summarises implied enterprise value, equity value per share, upside vs. current market price, revenue CAGR, WACC used, and exit EBITDA margin
What's in the Excel file
- Cover: Title page, disclaimer, table of contents
- Assumptions: All projection drivers — edit the green cells to run scenarios
- Income Statement: 5 historical + 5 projected years (Revenue → EBITDA → Net Income)
- Balance Sheet: 5 historical + 5 projected years
- Cash Flow: Indirect method — operating, investing, financing
- DCF Valuation: Unlevered FCF bridge, WACC build-up, terminal value, equity bridge, sensitivity table (WACC × terminal growth rate)
- Summary: Key metrics dashboard + implied vs. current price
Data sources
Yahoo Finance — annual income statement, balance sheet, cash flow, beta, market price
SEC EDGAR — CIK lookup, SIC code, filing metadata
Your spreadsheet — parsed entirely locally; no data is sent externally
Default model assumptions
Revenue growth: 3-year historical CAGR fading to 5% by Year 5
Margins: 3-year trailing averages (override on the Assumptions tab)
WACC: CAPM using Yahoo Finance beta, 4.5% risk-free rate, 5.5% equity risk premium
Terminal growth rate: 2.5% (long-run nominal GDP)
All assumptions are visible and editable in the Assumptions tab
Requirements
Python 3.9+, internet access for public companies. Dependencies install automatically via pip install -r requirements.txt (yfinance, openpyxl, pandas, requests, numpy).
Disclaimer
This Agent does not constitute professional financial advice. Users should consult a licensed financial advisor before making financial decisions.


