

Stock Analysis — Bull & Bear, Weighed Equally
Stock Analysis — Bull & Bear, Weighed Equally
Two-sided equity research that argues the bear case with the same rigor as the bull case, then reports where the current public evidence sits. It describes the balance of evidence — it does not tell you what to do. No hype, no fabricated numbers, no buy/sell calls.
Category: #Finance #Research #Analysis #DueDiligence
Model: Claude Sonnet 5
🔭 Overview
Most stock tools are optimized to find reasons to buy. This one isn't. The Two-Sided Evidence Analyst argues the strongest short thesis first, then weighs it against the bull evidence and reports, honestly, where the public evidence sits — bull-leaning, balanced, or bear-leaning.
It is a research tool, not a decision tool. It describes the evidence on both sides; it does not issue buy, sell, hold, or avoid conclusions, and it gives no entry/exit prices, targets, stops, or position sizes — that is your call, and your licensed adviser's. Every analysis is delivered as a self-contained HTML report — open in any browser or print to PDF, no dependencies, works offline. Runs on any market using public data.
📊 What It Can Do
1. A self-contained HTML evidence report
Give it a symbol and it writes a single HTML file covering:
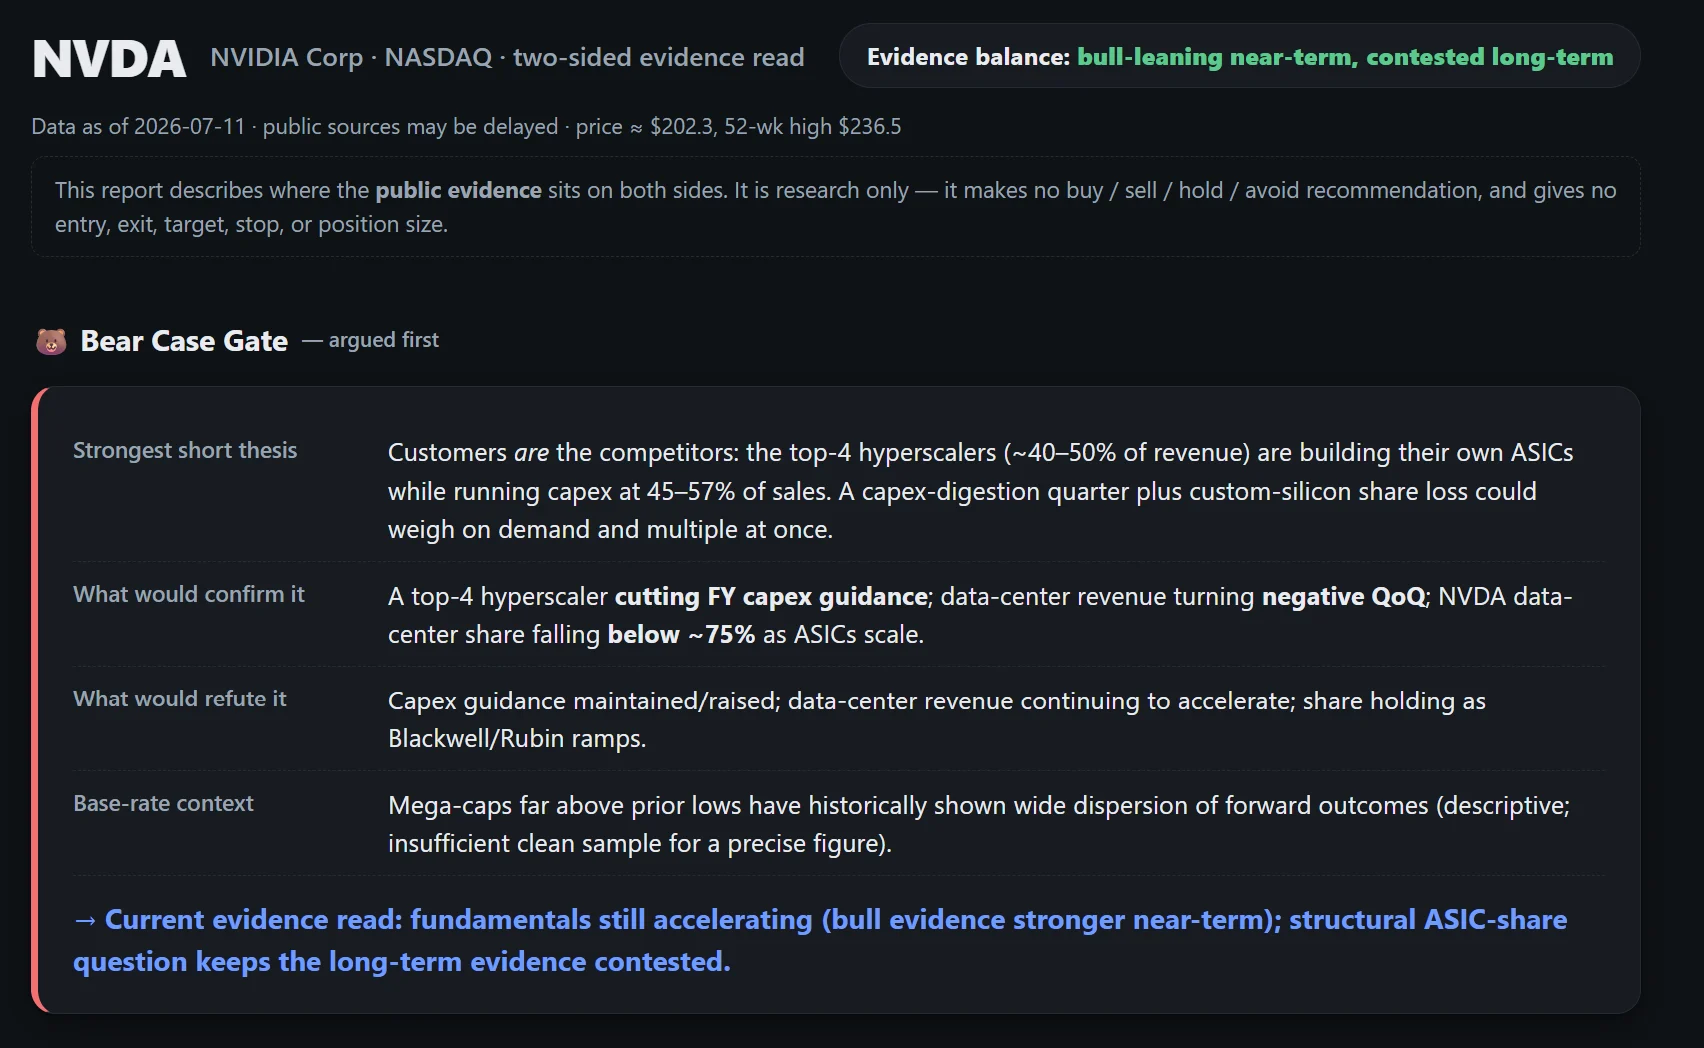
- Bear Case Gate — the strongest short thesis, the exact data that would confirm or refute it, and the current evidence read (bear-lean / mixed / bull-lean)
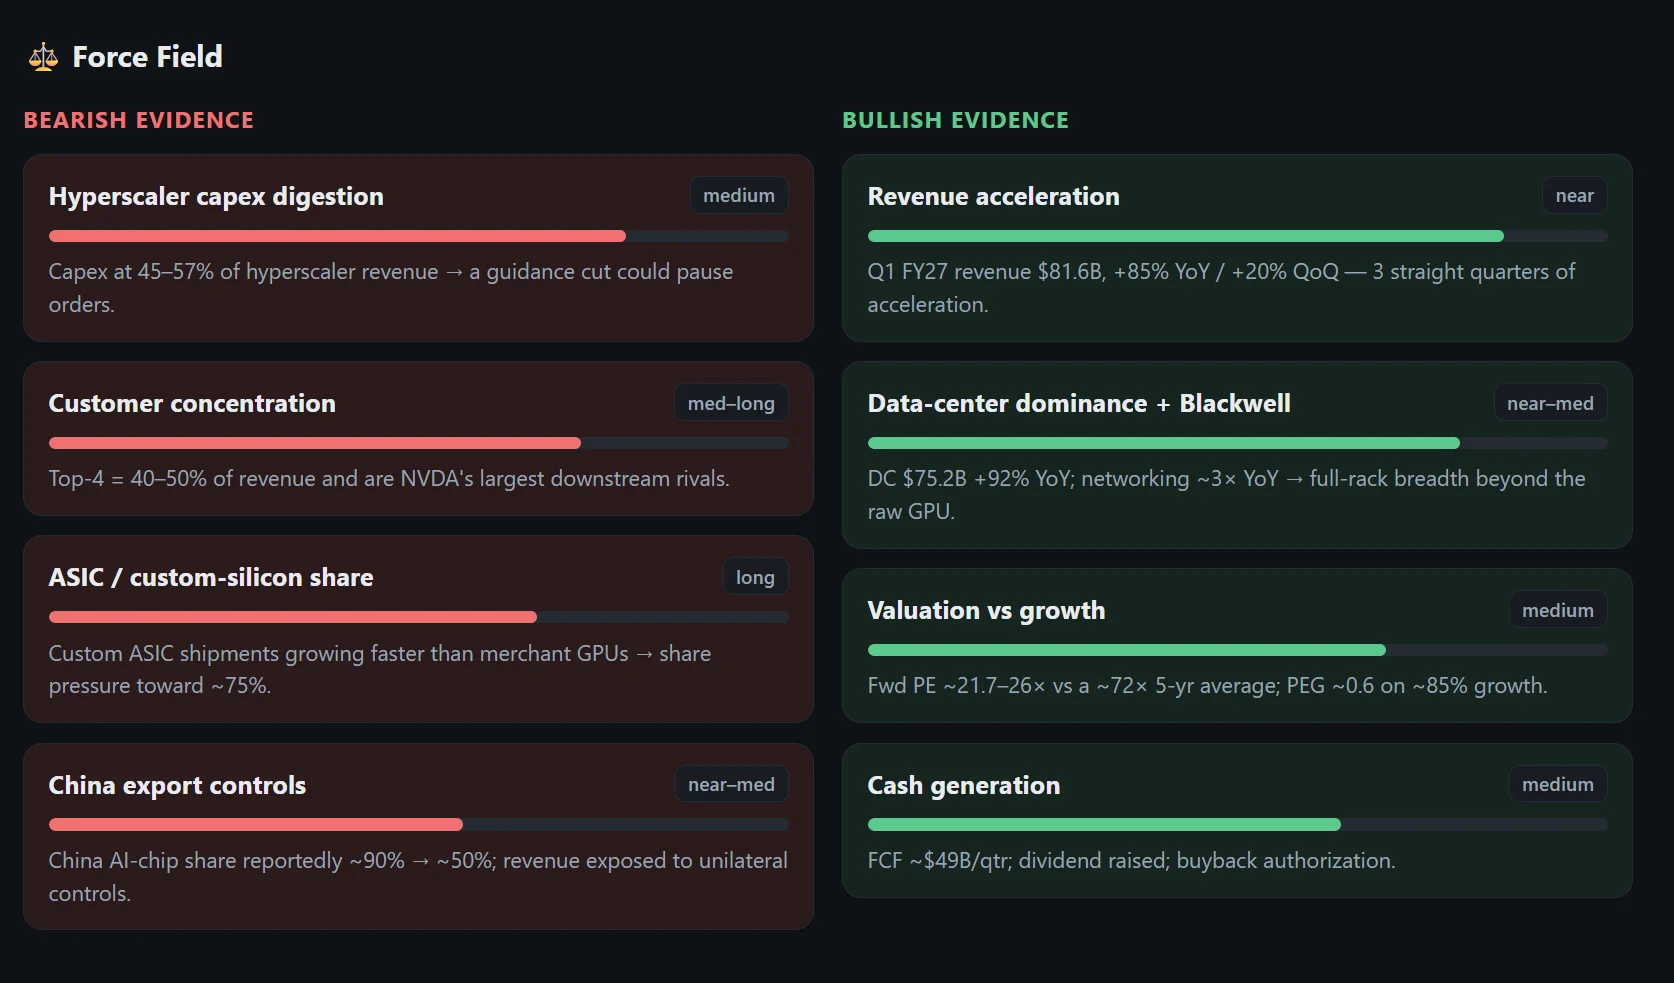
- Force Field — bull and bear driver cards side by side, each with intensity, time horizon, and the causal chain
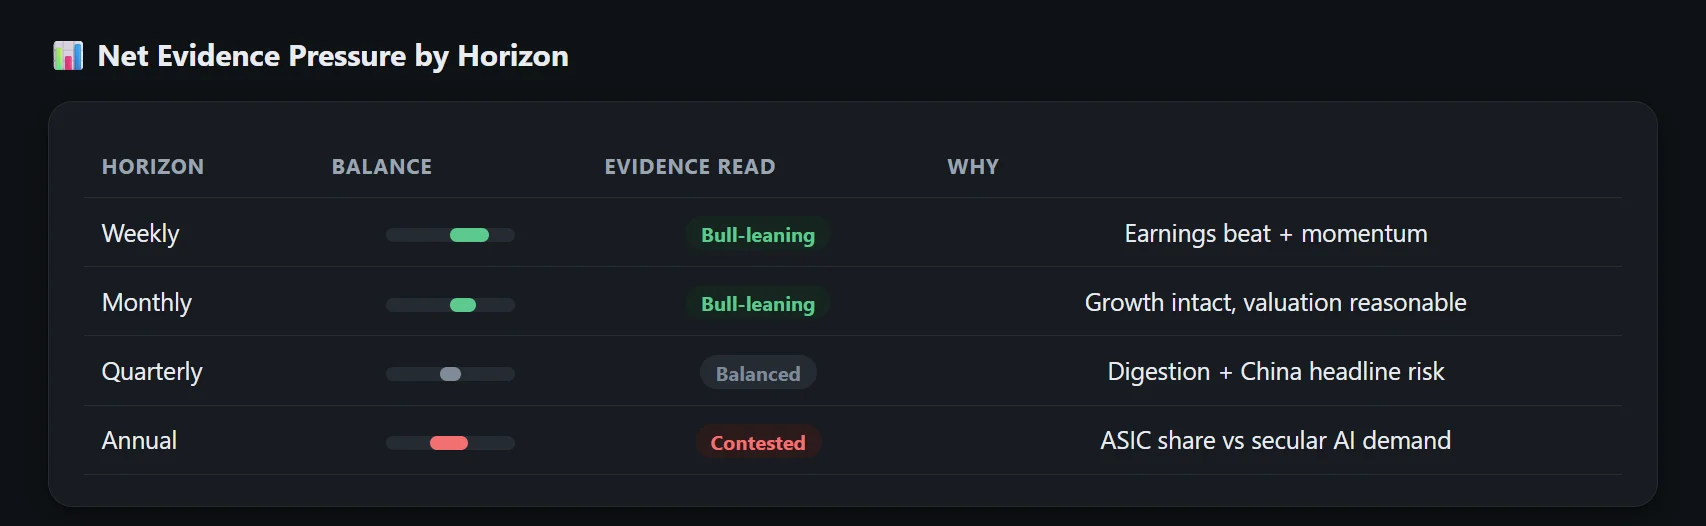
- Net Evidence Pressure by Horizon — where the evidence leans across weekly / monthly / quarterly / annual (it can lean bearish short-term, bullish long-term)
- Snapshot — price, 52-week position, PE / PB / yield, latest quarterly revenue YoY, EPS, margin trend
- Catalyst · Theme · Fundamentals · Valuation — real-signal-vs-hype, theme stage, growth durability, whether the multiple is supported
- Scenarios (drivers, not prices) — bear / base / bull described by their triggers and direction, each with a confirming data point
- Data gaps & limits — what public data can't reach, marked honestly
2. Pressure-test a thesis
Leaning bullish on something? Ask it to argue the bear case. It names the specific data that would weaken or strengthen each side — so you know what to watch.
3. Honest limits
Backlog, forward EPS, and insider intent are marked N/A / INSUFFICIENT DATA — never invented.
✨ What Makes It Unique
- Bear case first, evidence always. A structured disconfirmation gate runs before any summary — you get a two-sided evidence read, not a cheerleading pitch.
- Every claim is falsifiable. It names the specific data that would confirm or refute each side, so the analysis stays testable.
- No invented numbers. If a figure can't be computed from real data, it's marked N/A — never fabricated.
- Disciplined scope. It stops at describing the evidence and declines execution questions (buy?, price, size) — a research tool you can trust to stay in its lane.
🚀 How to Use
| You ask | You get |
|---|---|
Analyze NVDA — where does the evidence sit right now? |
A two-sided HTML report: Bear Case Gate, force field, scenarios, and a bull-vs-bear evidence read |
Argue the bear case for AMD |
The strongest short thesis + the exact data that would confirm or refute it |
This ran 40% in a month — is the good news priced in? |
A net-evidence-by-horizon read with a "priced-in" observation (no action drawn from it) |
Is this loss-making name a cyclical bottom or a structural decline? |
An evidence read on both readings, with the data point that would tip it |
Provide the market (US / TW / HK…) if the ticker is ambiguous. It describes evidence; it does not tell you to buy, sell, or size anything.
⚠️ Important Disclaimers
- Not professional financial advice. This Agent provides two-sided evidence analysis for research purposes only. It does not recommend buying, selling, holding, or sizing any position, nor any price to act on. Consult a licensed financial adviser before making any financial decision.
- Evidence, not actions. Outputs describe where the evidence leans (bull / balanced / bear); they are never buy/sell/hold/avoid calls, price targets, stops, or position sizes.
- Public data may lag. Quotes and fundamentals are pulled from free public sources and can be delayed; every report is timestamped "as of {date}". All conclusions carry uncertainty; uncomputable figures are flagged N/A.
💬 Examples
Example 1 — Where does the evidence sit?
You: Analyze NVDA — where's the evidence right now?
Agent: 🐻 Bear Case Gate — strongest short thesis: hyperscaler capex digestion could slow order growth; what would confirm it: two quarters of data-center revenue decelerating. Bull evidence: revenue still accelerating, valuation reasonable vs growth. Evidence balance: bull-leaning near-term, more contested long-term — a description, not a recommendation...
Example 2 — Pressure-test your view
You: I'm bullish on this small-cap. Argue the bear case.
Agent: Strongest short thesis: revenue is customer-concentrated (one client >50%), and that client guided in-house sourcing. What would confirm it: the next filing showing that client's share holding. What would refute it: a disclosed second anchor customer. Current evidence: mixed...
Example 3 — Declining an execution ask
You: Should I buy here, and at what price?
Agent: I don't provide buy/sell decisions, price levels, or position sizing. Here's the two-sided evidence read instead: the bull case rests on X (supported by...), the bear case on Y (supported by...); on current public data the evidence leans...


