Stock Value Brief: 8-Section Valuation Study
Stock Value Brief
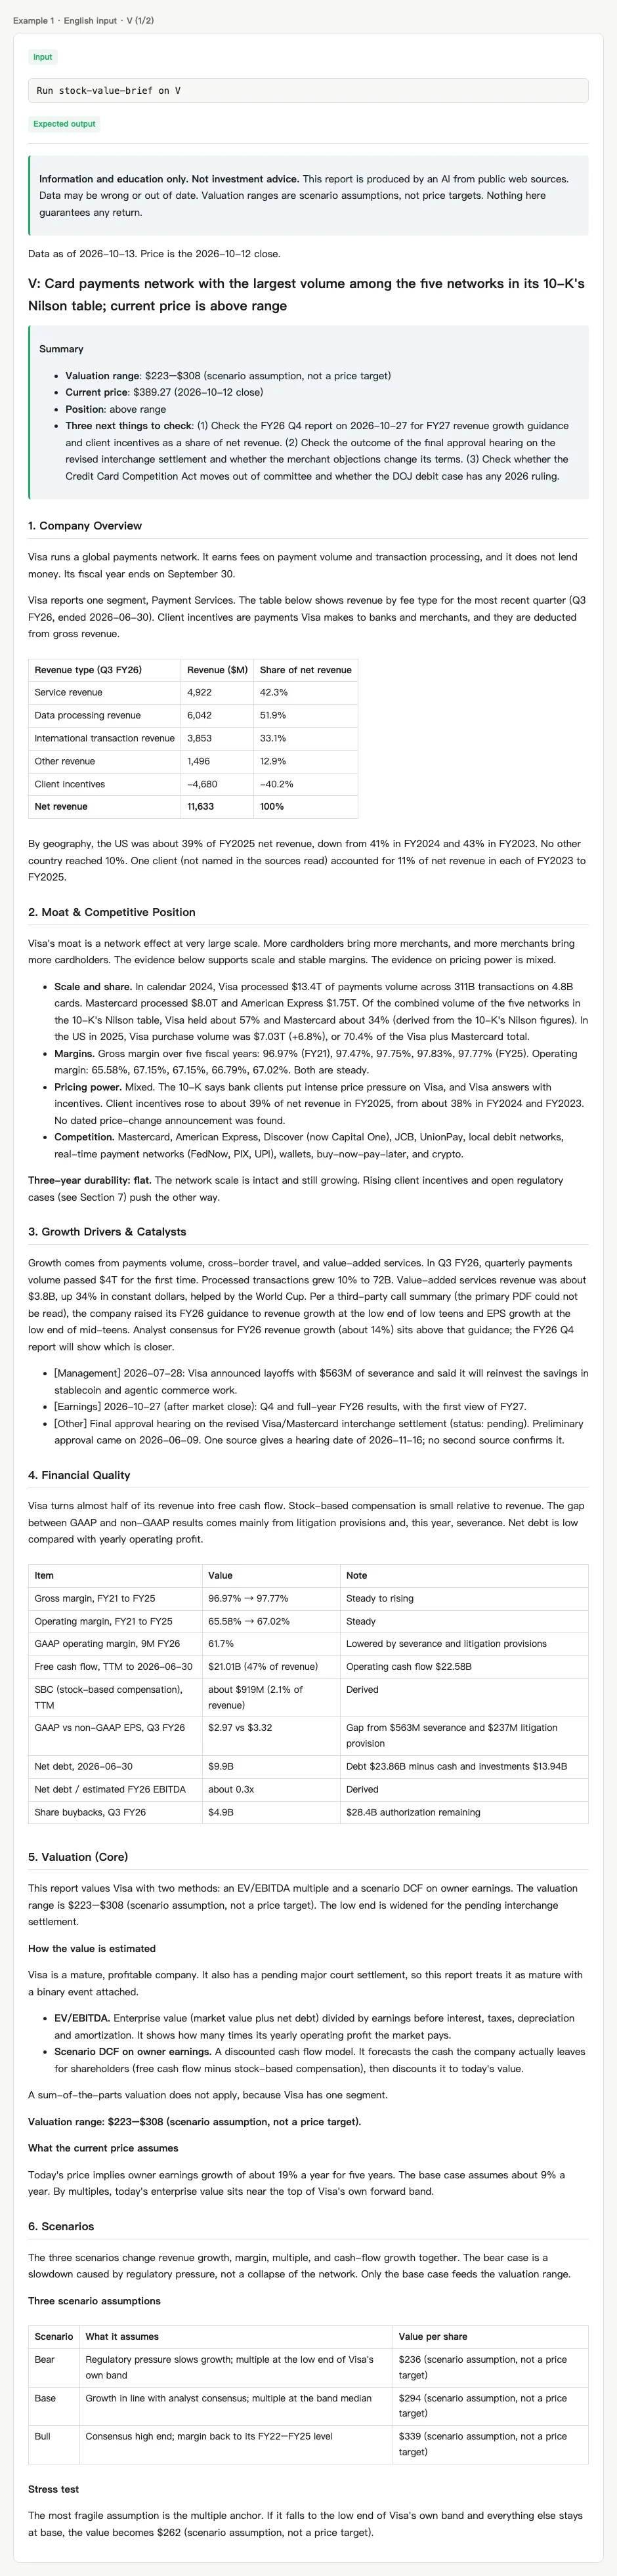
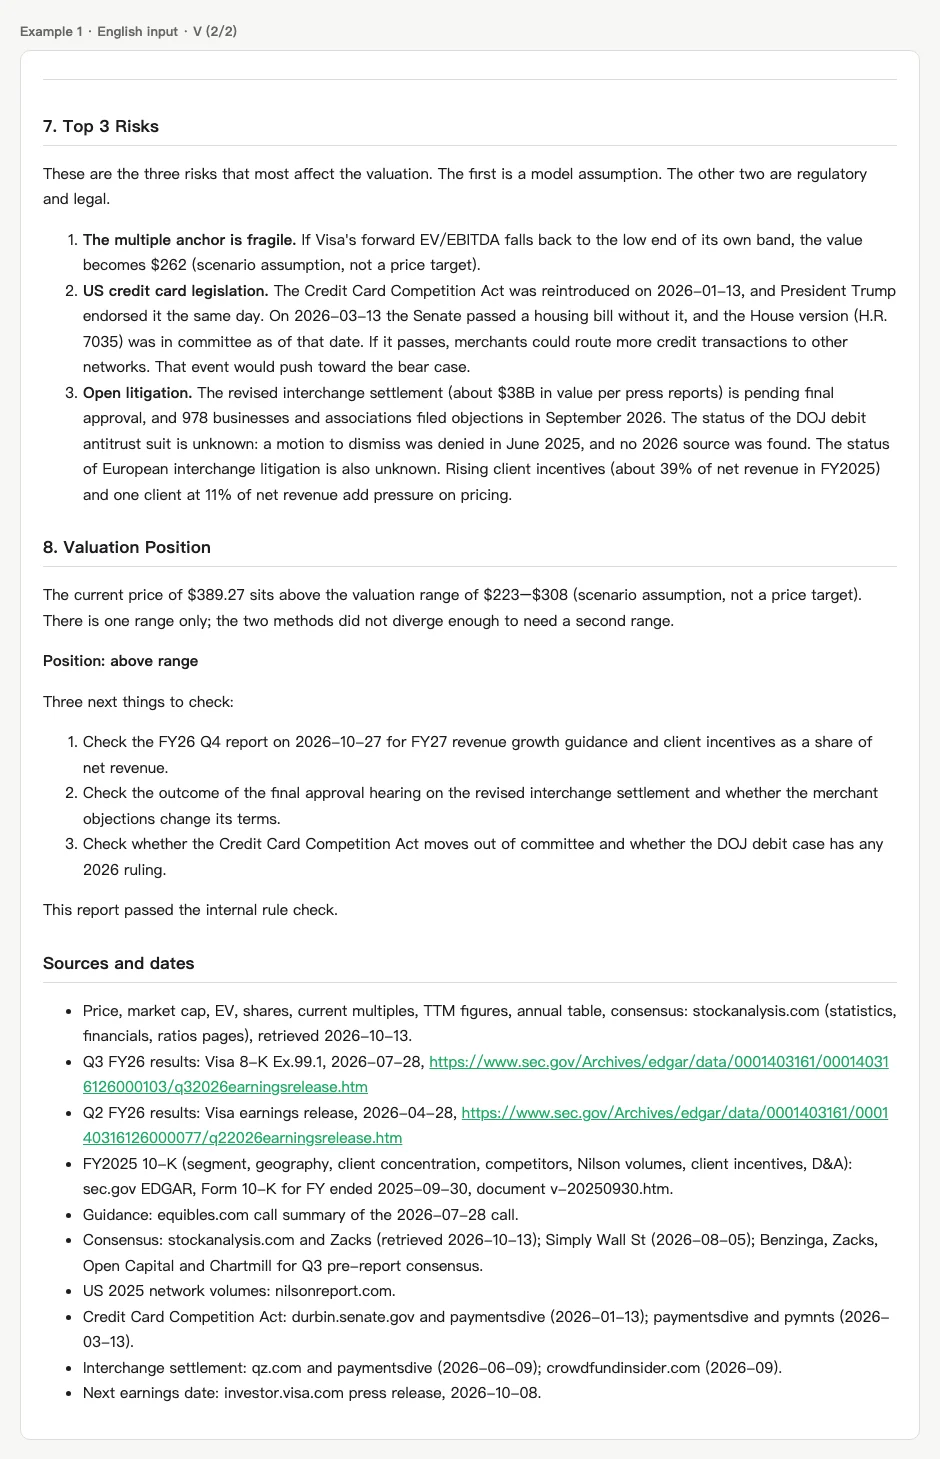
Type one ticker. Get a full 8-section valuation study of the company in one Markdown file. Key figures carry their source and date; conflicting or missing data is flagged, never guessed.
Disclaimer. This skill produces research for informational and educational purposes only. It is not investment advice. It does not recommend buying, selling or holding any security. Valuation ranges are scenario assumptions, not price targets, and past data does not guarantee future results. The reports are generated by AI from public web data, which may be wrong or out of date. Check the figures yourself before you make any decision.
What it saves you
- No more tab-hopping. The skill searches filings, earnings coverage and data sites for you (15–25 lookups per run) and puts it all in one report.
- Same structure every time. Run it on two companies and compare them section by section.
- Every assumption on the table. Growth rate, discount rate and multiples are written out, so you can change any of them and redo the math.
- You know what to double-check. Each report ends with its sources and dates, plus a list of data it could not find.
- Plain language. Each metric gets a one-line explanation at first use, and a glossary is included.
What's in the report
- Company overview: what it sells, revenue by segment
- Moat & competitive position: 5-year gross margins, market share
- Growth drivers & catalysts: dated, tagged as earnings / product / other
- Financial quality: margins, free cash flow, stock-based comp, net debt
- Valuation: two methods side by side (for example owner-earnings DCF plus EV/EBITDA against the company's own history), and why those methods fit this company
- Scenarios: bear / base / bull assumptions, plus a stress test on the weakest one, plus the events that would trigger the bear case
- Top 3 risks
- Valuation position: where today's price sits against the calculated range, plus three things to check next
The method adapts to the company: mature, high-growth, pre-profit, or multi-segment (sum-of-the-parts when it applies).
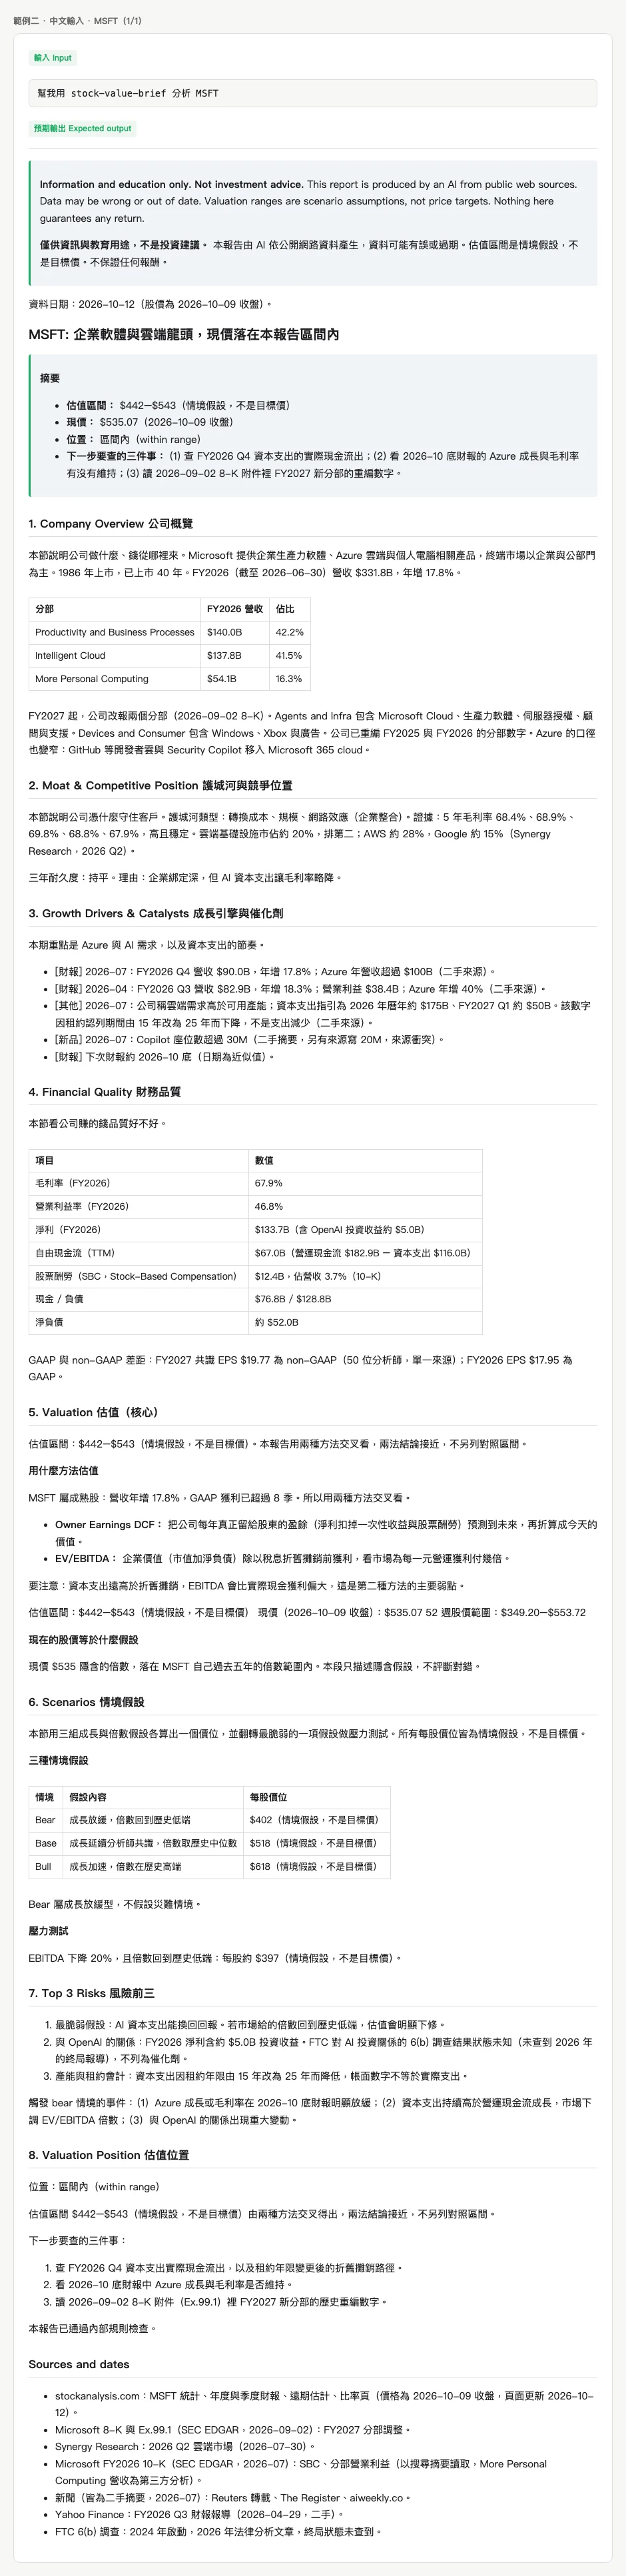
Example: end of the included MSFT report
Position: within range
Next three things to check: (1) actual FY2026 Q4 capex cash outflow; (2) whether Azure growth and gross margin hold in the late-October earnings; (3) the restated segment numbers in the 2026-09-02 8-K.
Two full sample reports come in the download: MSFT (Traditional Chinese) and V, Visa (English).
How to use
Requires Claude Code with web search. No API key, no extra account.
- Put the
stock-value-brieffolder in~/.claude/skills/. - In Claude Code, type:
Run stock-value-brief on NVDA - The report is saved to
reports/NVDA-value-brief.md.
Ask in English and the report comes back in English. Ask in Chinese and it comes back in Traditional Chinese.
FAQ
Does it work in the Claude chat app? It is built for Claude Code, which can run subagents. Plain chat has a fallback mode with lower quality.
Which stocks? Built and tested on US-listed stocks.
Is the data current? It is pulled from the public web when you run it. Each figure carries its date.
Stock Value Brief(繁體中文)
輸入一個股票代號,得到一份八段式的公司估值研究。關鍵數字附來源與日期。來源衝突或查不到的資料會標出來,不會用猜的。
免責聲明。 本 skill 產出的內容僅供研究與教育用途,不構成投資建議,也不建議買進、賣出或持有任何證券。估值區間是情境假設,不是目標價。過去的數據不保證未來的結果。報告由 AI 依公開網路資料產生,資料可能有誤或過期。做任何決定前,請自行查證數字。
幫你省下什麼
- 不用再開十個分頁。 skill 自己去查財報、法說會報導和數據網站(每次 15–25 次查詢),整理成一份報告。
- 每次結構都一樣。 跑兩家公司,就能逐段比較。
- 假設全部攤開。 成長率、折現率、倍數都寫出來,你可以改任何一個自己重算。
- 知道哪裡要再確認。 報告最後列出來源、日期,以及查不到的資料。
- 白話說明。 每個指標第一次出現都有一句解釋,附術語表。
報告內容
- 公司概覽:賣什麼、各分部營收
- 護城河與競爭位置:五年毛利率、市佔率
- 成長引擎與催化劑:附日期與類型
- 財務品質:利潤率、自由現金流、股票酬勞、淨負債
- 估值:兩種方法並陳(例如 Owner Earnings DCF 加上公司自己的歷史 EV/EBITDA),並說明為什麼這個方法適合這家公司
- 情境假設:bear/base/bull 三組假設,加上對最脆弱假設的壓力測試,並列出會觸發 bear 情境的事件
- 風險前三
- 估值位置:現價落在計算區間的哪裡,加上下一步要查的三件事
方法會依公司類型調整:成熟股、高成長股、尚未獲利、多分部(需要時用分部加總)。
怎麼用
需要 Claude Code,並開啟網路搜尋。 不需要 API key,不需要另外註冊帳號。
- 把
stock-value-brief資料夾放進~/.claude/skills/。 - 在 Claude Code 輸入:
幫我用 stock-value-brief 做 NVDA 的估值研究 - 報告存在
reports/NVDA-value-brief.md。
用中文問,報告就是繁體中文。下載內含兩份完整範例:MSFT(繁中)、V/Visa(英文)。