

输入任意美股代码,或两只一起比。一分钟告诉你 X 上谁看多、谁看空、为什么,按点赞数加权,附股价、粉丝数和原推文链接,还有 HTML 看板。营销号和喊单帖先过滤。每天免费 1 次。非投资建议。
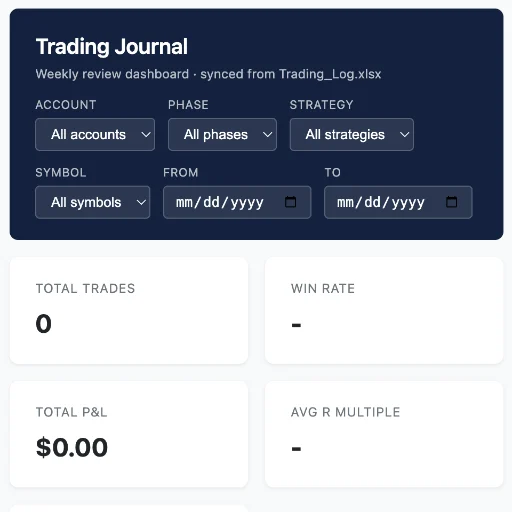
A single-file trading journal dashboard that turns every trade into data. See win rate, average R multiple and expectancy at a glance, so you know if a strategy really works. Filter by account, phase, strategy, symbol or date. Track cumulative P&L, profit by symbol, and weekly results. Live accounts get balance, profit above principal, and suggested weekly withdrawals at a percentage you set. Sortable trade log, no signup, no install. Your data stays with you. A tool for review, not advice.

Values a profitable private company in any country and any currency, returning a live-formula Excel model and a memo concluding on a range — DCF, capitalized earnings, real named listed peers and an asset floor, with normalization and a country-risk-adjusted cost of capital. Your financial statements never leave your machine, and every peer figure carries its source. A calculated value to negotiate from, not a certified appraisal. Not for listed companies or pre-revenue startups.

Name any AI stock, crypto, or Japanese equity — get a full capital flow intelligence report showing exactly where money is moving and why prices follow.

一則 AI 合作公告,究竟是意向、訂單,還是已認列收入?貼上公開原文,取得證據對照、待核實清單與下一個驗證節點;也可整理美股多空情境、計算公開日線。逐項標明資料日期、來源與缺口。最新資料核實取決於可用的搜尋/瀏覽工具。僅供研究,不構成專業財務或投資建議。


Paste financial statement data and get a professional-grade diagnostic in minutes: Seeking-Alpha-style factor grades (A+ to F, sector-relative), a thesis-led variant view, earnings quality with accruals screening and a YoY profit bridge, 5-step DuPont ROE, cash conversion cycle, valuation multiples vs sector with a what's-priced-in check, graded risks, catalysts, analyst questions — plus a print-ready infographic one-page HTML report. Analysis only, never investment advice.
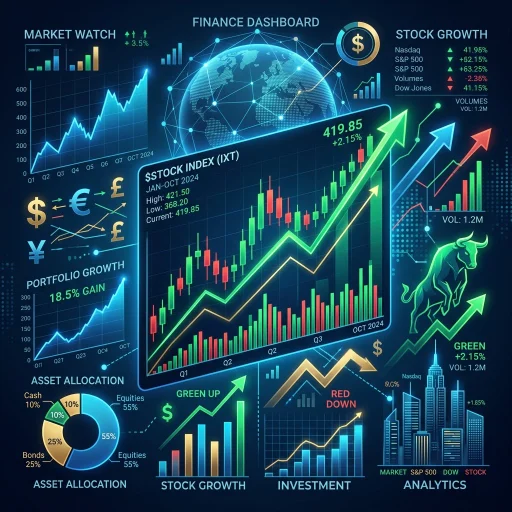
美股財報太長?輸入 Ticker (如 NVDA),AI 秒讀 10K 財報並畫出財務五線譜!一眼看穿泡沫或低估。🎁每日免費試用3次 Too many US stock earnings reports? Enter "Ticker" (e.g., NVDA), and AI will instantly read 10,000 earnings reports and draw a financial chart! Spot bubbles or undervaluations at a glance. 🎁 Try it for free 3 times daily.