

黃金CFD(XAUUSD)智能分析助手—提供技術面(均線、RSI、布林通道、Price Action、MACD/KD、費波那契回撤、成交量、經典圖表型態如杯柄、頭肩、雙頂底等)、基本面(非農、CPI、美元指數、實質利率、黃金ETF持倉、央行儲備等)與消息面風險的結構化交易分析,附止損與倉位計算、交易風格建議,以及每日市場簡報。 Gold CFD (XAUUSD) Analysis Assistant — structured trading analysis across technicals (moving averages, RSI, Bollinger Bands, Price Action, Fibonacci retracement, chart patterns, head and shoulders, double top/bottom, flags), fundamentals , news-event risk, stop-loss/position sizing, trading-style fit, and daily market briefings.

Xで注目される市場の有力アカウントを追跡し、分散した株式見解、ニュース、資金フロー、公開された取引情報を、毎日の市場コンセンサスダッシュボードにまとめます。同じ銘柄について強気、弱気、または明確な見解なしの投資家を確認し、それぞれの分析理由、意見の相違、変化する見方を比較できます。多言語レポートとアカウント横断の銘柄分析に対応しています。公開情報のみを使用しており、投資助言ではありません。

每天打開盤面,資訊太碎、資產太多,不知道全球資金現在究竟往哪裡流? 「全市場跨資產脈動分析師」專為解決跨市場資訊割裂而設計,能夠在短時間內為你整合全球核心資產的即時現況,精準回答「目前市場正在發生什麼事」。 核心分析維度: • 全球貨幣流動性追蹤:監控主要央行政策動向、市場資金水位與流動性寬鬆/緊縮變化,掌握大資金的底層邏輯。 • 跨資產聯動與現況解讀:同步掃描全球股市、美元指數(DXY)、黃金與比特幣(BTC)的當前表現,釐清各類資產之間的資金輪動與避險情緒。 • 關鍵技術關卡掃描:自動標示各大類資產目前所處的關鍵支撐、壓力位與多空分水嶺,協助你快速定位市場位置,不被短期雜訊干擾。 適合對象: 需要快速掌握全球宏觀盤勢的跨市場交易員、資產配置者,以及希望在開盤前高效建立大局觀的投資研究人員。
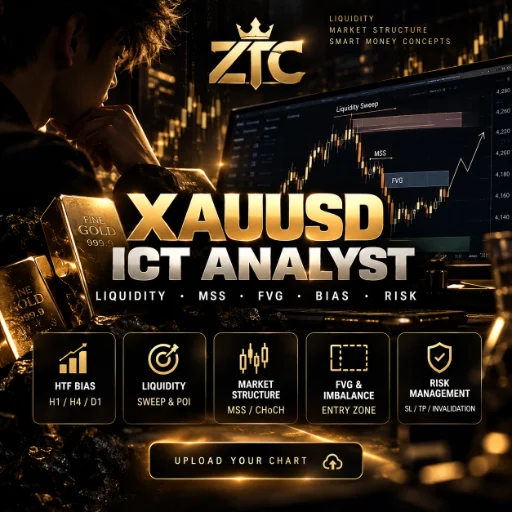
Upload your XAUUSD chart and get a structured ICT-style analysis covering HTF bias, liquidity, MSS, FVG, market structure, bullish and bearish scenarios, invalidation, and risk planning.

Educational daily market research tool for stocks, crypto, forex, ETFs and indices, grounded in live prices and news pulled via web search. Enter your watchlist (up to 6 assets) and get sentiment, educational research views, macro event awareness, and weekly outlook. Covers US, Indian, European, Asian, crypto and forex markets, in 20 languages. Not investment advice.

CryptoPulse turns scattered crypto market signal into one daily read: what's trending, what's actually moving and why, sentiment, headline news, and on-chain whale flow — synthesized, not just listed. Ask for the full dashboard as a shareable HTML file, or just ask "what's up with SOL today" and get a straight answer in chat.

Type any ticker, or two to compare. In about a minute: who on X is bullish or bearish and why, like-weighted, with price context, follower counts and links to every post, plus an HTML dashboard. Promo and bait accounts filtered. 1 free report a day. Not investment advice.

Analyzes PC hardware prices, discounts, seller reliability and market timing to tell you whether to buy now or wait. Compares current prices, recent lows, real discounts, seller risk and build compatibility, then returns a clear 0–100 score and verdict.

Which sectors truly attract capital, and which rise only because nobody sells. Method: sector trading-value share divided by market-cap share, crossed against price. Up + up = real inflow Up + down = capitulation Down + up = fragile, no new money Down + down = abandoned Quadrant three is the edge: most watch price alone and mistake fragile rallies for real. One rule it will not break: trading value is not inflow. Every trade has two sides. Real net flow shows only in investor-type data.