

Investigación de acciones de EE. UU. y Corea en una sola skill: previas y resúmenes de resultados, filtros por reglas (CANSLIM, dividendos, momentum), revisión de cartera, diseño de backtests y resúmenes de mercado. Cada cifra lleva fuente y fecha. No ejecuta órdenes ni da asesoramiento de inversión.
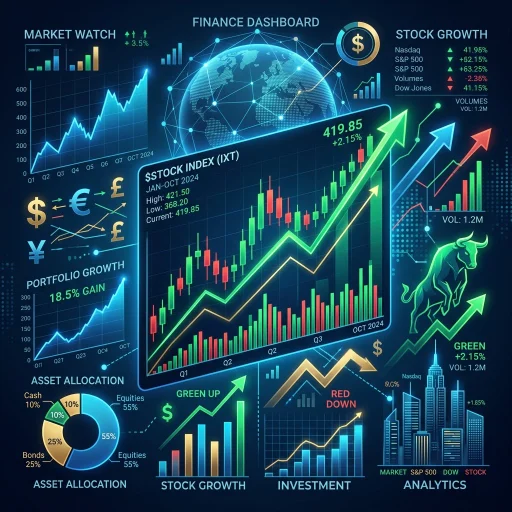
美股財報太長?輸入 Ticker (如 NVDA),AI 秒讀 10K 財報並畫出財務五線譜!一眼看穿泡沫或低估。🎁每日免費試用3次 Too many US stock earnings reports? Enter "Ticker" (e.g., NVDA), and AI will instantly read 10,000 earnings reports and draw a financial chart! Spot bubbles or undervaluations at a glance. 🎁 Try it for free 3 times daily.
See what a stock's price is really betting on. From official SEC filings, this Agent shows the cash flow growth and returns the market needs to justify today's price, and compares them with the company's last five fiscal years. You get an Excel model with live formulas and a PDF report: multiples, ROE, margins, reverse DCF. For companies filing annual reports with the SEC; you provide the share price. No price targets, no buy/sell calls. Not investment advice.

Enter a Taiwan stock ticker and generate a visual research report: MA/EMA, price-volume, revenue and institutional flows. Local Python GUI; no model key. 輸入台股代號,自動產生均線、量價、營收與法人視覺報告。本機Python介面,不需模型金鑰。

Type any ticker, or two to compare. In about a minute: who on X is bullish or bearish and why, like-weighted, with price context, follower counts and links to every post, plus an HTML dashboard. Promo and bait accounts filtered. 1 free report a day. Not investment advice.

Structured financial statement analysis for US public companies: 26 indicators across 6 categories (profitability, capital return, solvency, efficiency, growth, valuation), DuPont dec omposition, three-statement linkage, 5-step workflow. Accepts company name, ticker, or CIK; auto-fetches free SEC EDGAR + market price data, outputs structured conclusions with risk fla gs. Use when analyzing a US-listed company's financials (e.g. "analyze AAPL"). Informational only; not investment advice.

台股量化研究系統的部署與解讀助手:協助你在自己的機器建置研究pipeline(安裝、資料回補、排程),解讀模型訊號的一般意義、辨識資料缺口、理解回測的侷限,並提供模型資產保護與工程紀律SOP。純研究與工程教育用途,不提供買賣建議、進場價位、停損目標價或部位配置;此類請求會被引導至一般性研究解讀或建議諮詢持牌專業人員。非投資建議。

Don't ask what a stock is worth — ask what today's price already assumes. Four valuation methods, three scenarios, a discount-rate by growth sensitivity table, and the growth rate the market is implying. Calculation only, never a recommendation.

Paste financial statement data and get a professional-grade diagnostic in minutes: Seeking-Alpha-style factor grades (A+ to F, sector-relative), a thesis-led variant view, earnings quality with accruals screening and a YoY profit bridge, 5-step DuPont ROE, cash conversion cycle, valuation multiples vs sector with a what's-priced-in check, graded risks, catalysts, analyst questions — plus a print-ready infographic one-page HTML report. Analysis only, never investment advice.